Unlocking Defensive Mastery: Introducing the Expected Disruption (xD) Model in Football Analytics
Quantifying the unseen impact of defensive actions on the pitch
The Art of Anticipation
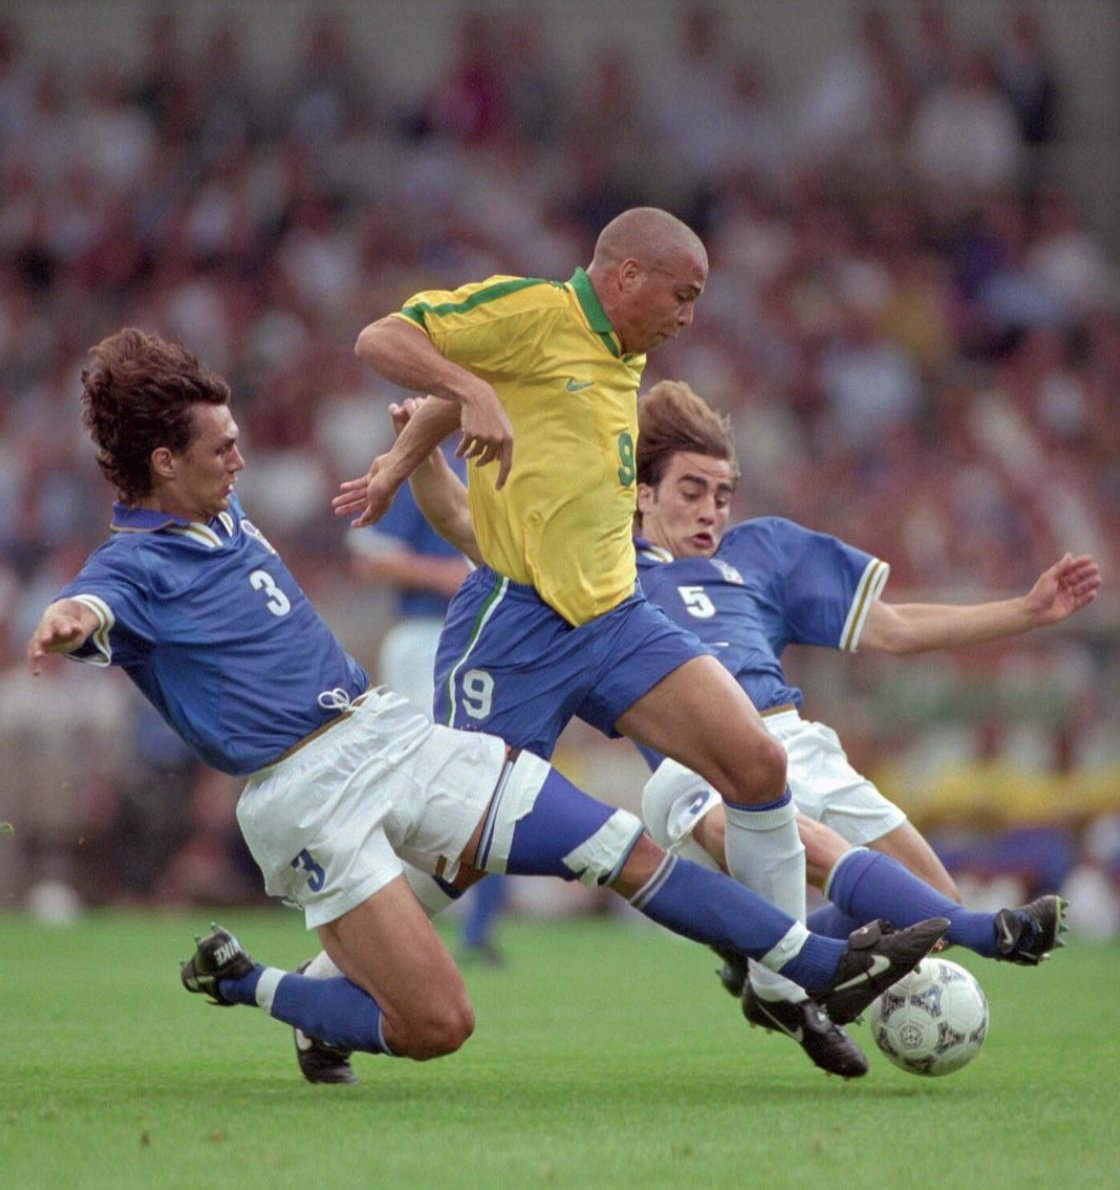
Defensive anticipation is one of football’s greatest, yet often overlooked, arts — the ability to read the game, disrupt danger, and turn chaos into control. Few players embodied this skill as profoundly as the legends captured in the photograph above: Ronaldo Nazário, surging forward with unmatched brilliance, and Paolo Maldini and Fabio Cannavaro, poised to neutralize the threat with their mastery of defensive timing and awareness. On this occasion, Maldini had to take one for the team, committing a tactical foul just outside the box to deny a clear goal-scoring opportunity.
This moment exemplifies the delicate balance between attack and defense—a duel that defines the game but often goes unnoticed. While attacking brilliance tends to grab the headlines, it’s the defenders’ unseen, decisive interventions, like Maldini’s, that quietly shape the outcome of matches.
Building on the revolutionary work of Sam Green’s Expected Goals (xG), Karun Singh’s Expected Threat (xT), and Sarah Rudd’s pioneering Markov chain model, it’s time to extend this analytical rigor to defense. The Expected Disruption (xD) model does just that, shining a light on the subtle genius of defensive actions and their impact on the game.
The Need for a New Defensive Metric
Traditional defensive statistics like tackles and interceptions provide raw counts but fail to capture the contextual value of these actions. A tackle in the opponent’s half isn’t equal to a last-ditch block inside the penalty area. Existing defensive metrics often lack the nuance required to assess a player’s true impact, treating all actions equally and ignoring the varying degrees of threat posed by different attacking moves.
Key Questions:
- How can we measure the effectiveness of a defender’s actions in terms of the threat they prevent?
- Can we assign a quantifiable value to defensive disruptions based on their location?
Defensive Action Categories
To effectively measure defensive impact, it’s crucial to categorize the different types of defensive actions players undertake. In this analysis, I consider offsides, pressures, tackles, interceptions, ball recovery, blocks, dispossessed, goalkeeper actions (smother, collected crosses, punches, sweeper).
For each of these defensive actions, it is deemed successful if it leads to the defending team regaining possession of the ball. This contextual success is what the xD model aims to quantify, providing a more accurate measure of a player’s defensive contributions.
Building the Expected Disruption (xD) Model
Data Utilized
For this analysis, I utilize data from the 2015/2016 season across the English Premier League, La Liga, Ligue 1, Bundesliga, and the Italian Serie A. This comprehensive dataset allows us to capture a diverse range of defensive actions across top-tier European leagues.
Dividing the Pitch into Zones
To start, I take a similar approach to Karun Singh’s xT model and divide the pitch into 192 zones with 12 zones across the width and 16 across the length. Each zone represents a specific area where defensive actions can occur. This spatial framework allows us to analyze actions relative to their location on the field.
The Mathematical Model
The expected disruption value for a defensive action in zone (x,y) is calculated using Equation (1) below:
xD(x,y) = ( f(x,y) ⋅ s(x,y) ) + ( l(x,y) ⋅ ΣzΣw T(x,y)→(z,w) ⋅ xT(z,w) ) (1)
Breaking It Down
-
First Term f(x,y) ⋅ s(x,y):
This term quantifies the immediate impact of disrupting a shot in zone (x,y).
- f(x,y) is the probability of defensive actions in zone (x,y) leading to successful disruption of shots taken from this zone.
- s(x,y) is the shot probability from zone (x,y).
-
Second Term l(x,y) ⋅ ΣzΣw T(x,y)→(z,w) ⋅ xT(z,w):
This term accounts for the preventive effect of stopping the ball from moving into more threatening zones, thereby reducing the opponent’s scoring opportunities.
- l(x,y) is the probability of disrupting the ball from being moved from zone (x,y).
- T(x,y)→(z,w) represents the transition matrix storing the probability of a move from zone (x,y) to zone (z,w).
- xT(z,w) denotes the expected threat of moving the ball to destination zone (z,w), developed using the framework originally proposed in Karun Singh’s expected threat (xT) model, based on 2015/2016 season data from Europe’s top 5 leagues.
Now that we have the model description out of the way, let’s look at what the xD matrix looks like. Below is a visualization of the xD values across different zones on the football pitch. Note, the direction of play is oriented from left to right.
Hovering over each zone displays its specific xD value, indicating how defensive actions there influence the game by reducing the opponent’s chance of scoring within the next five actions—a concept inspired by Karun Singh’s xT model. The color intensity of each zone reflects the level of expected disruption, with lighter shades showing areas where defensive actions have a smaller impact.
The xD matrix assigns higher values to defensive actions performed further up the pitch, as disrupting play in these advanced areas significantly decreases the likelihood of the opponent converting possession into a scoring opportunity. Conversely, actions closer to the defending team’s own goal have lower xD values because they are less likely to reduce the scoring threat. Despite the stark spatial variability in xD values, a player’s xD score is elevated not just by where they act, but by consistently executing effective defensive interventions that neutralize threats and enhance their team’s defensive performance.
Why Players Should Be Evaluated by Pitch Thirds
The nature of the xD matrix and the varying responsibilities of players across different positions mean that evaluating players solely on aggregate metrics can be misleading. Instead, it’s more insightful to assess let’s say the top 10 players within each third of the pitch: Defensive Third, Middle Third, and Attacking Third.
Rationale Behind This Approach:
- Role-Specific Expectations: Goalkeepers, defenders, midfielders, and attackers have distinct defensive responsibilities. Comparing players within the same positional category provides a fair assessment based on similar roles and opportunities.
- Spatial Responsibilities: Defenders primarily operate in the defensive third, midfielders in the middle third, and attackers in the attacking third. Evaluating them within these zones aligns with their natural areas of influence.
Scatter Plot: xD per 90 vs. Defensive Actions per 90
To justify this evaluation approach, let’s present a scatter plot illustrating the relationship between Defensive Actions per 90 Minutes and xD per 90 Minutes across all top 5 leagues for the 2015/2016 season.
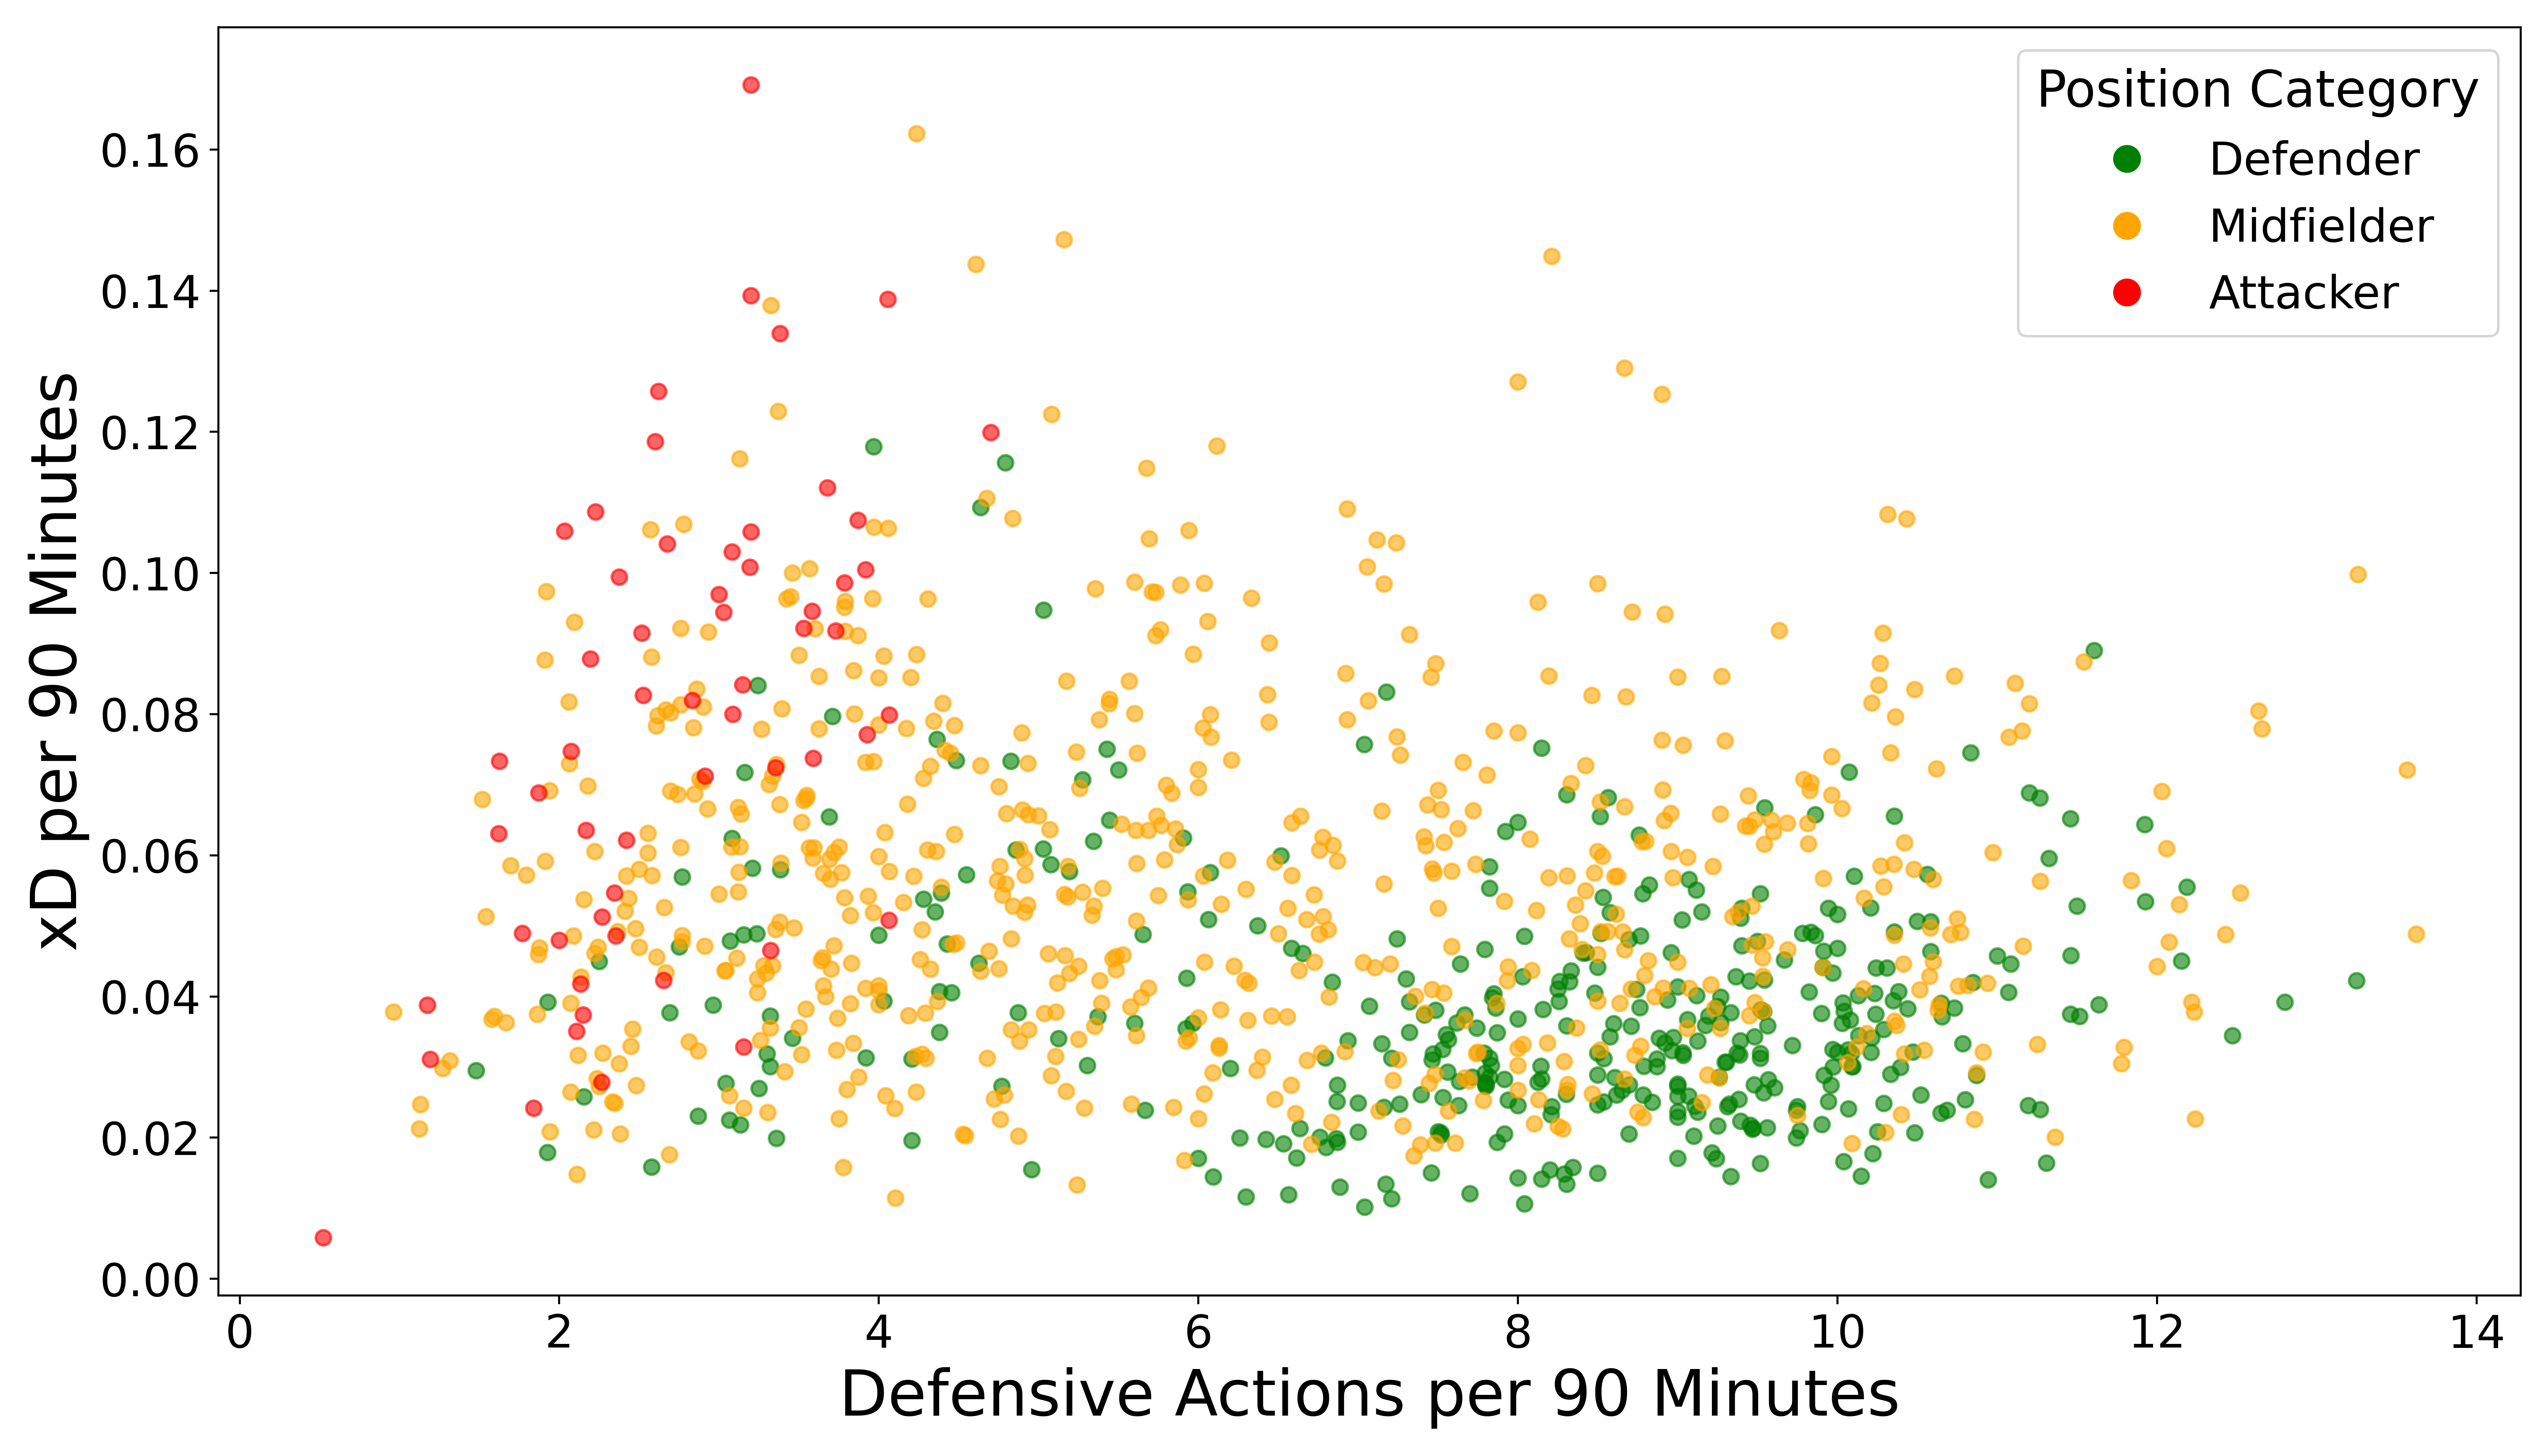
The scatter plot above vividly illustrates the distinct defensive profiles of defenders, midfielders, and attackers based on their xD per 90 minutes and Defensive Actions per 90 minutes.
- Defenders typically execute a high number of defensive actions closer to their goal where xD values are lower because the probability of conceding is still higher close to the defending team’s goal. Despite the lower xD per 90 minutes, their consistent involvement steadily contributes to their overall xD.
- Midfielders maintain a balanced number of defensive actions with moderate xD per 90 minutes, reflecting their pivotal role in both disrupting play and transitioning the ball. Their strategic positioning enables them to perform meaningful defensive actions in moderately high-value zones.
- Attackers perform fewer defensive actions but achieve higher xD per 90 minutes by concentrating in high xD zones near the opponent’s goal. Their elevated xD scores result from the quality and frequency of their defensive interventions in these critical areas.
Note on Goalkeepers: While goalkeepers play a critical defensive role with unique actions such as smothers, collected crosses, punches, and sweeping, their contributions are highly specialized and often incomparable to those of outfield players. To maintain clarity and ensure meaningful comparisons, goalkeeper data is something I won’t focus on in this particular analysis.
Limitations of the xD per 90 Metric
While the xD per 90 metric offers valuable insights into a player’s defensive impact, it has notable limitations:
-
Positional Bias: Players in different positions naturally have varying opportunities to perform defensive actions, leading to disparities in xD scores. For example, defenders typically engage in more defensive plays than attackers, but attackers perform theirs in higher xD regions, thus skewing raw xD comparisons across roles.
-
Frequency vs. Quality: A high xD per action may result from infrequent but impactful defensive plays, whereas frequent defensive actions with lower xD values might not accurately reflect a player’s overall defensive contribution.
To overcome these challenges, I believe the xD (Possession Adjusted) metric is more appropriate. By normalizing xD based on a team’s possession statistics, we can account for the differing levels of defensive opportunities across positions and playing styles. This adjustment provides a more equitable and accurate assessment of a player’s defensive effectiveness, ensuring fairer comparisons regardless of their role or team’s possession dynamics.
Why Adjust for Possession?
Teams with lower possession may naturally have more opportunities to perform defensive actions, potentially inflating xD scores. Adjusting for possession ensures that the xD metric accurately reflects a player’s defensive impact relative to their team’s control of the ball.
Evaluating Players from the English Premier League (EPL)
Focusing on evaluating players from the English Premier League (EPL) during the 2015/2016 season, we delve deeper into the defensive performances within a single league, providing a clearer picture of player contributions. For this analysis, only players with at least 2,000 minutes played were considered.
The charts below highlight the top 10 players in each third of the pitch based on their possession-adjusted xD (Expected Disruption). This metric evaluates a player’s defensive contributions relative to their team’s possession, ensuring fair comparisons across different teams and styles of play. Note, the length of the horizontal bars represents the total xD for the season (not adjusted for possession), derived from key possession-winning actions such as tackles, ball recoveries, blocks, interceptions, dispossessions, and pressures.
Interestingly, while a player’s total xD (not adjusted for possession) might place them high on the chart, their possession-adjusted xD accounts for the overall opportunities within their team structure. This dynamic sheds light on individual brilliance, regardless of whether they played for title-winning sides or relegation battlers. Let’s take a closer look at the breakdowns by pitch thirds.
Top 10 Players in the Defensive Third
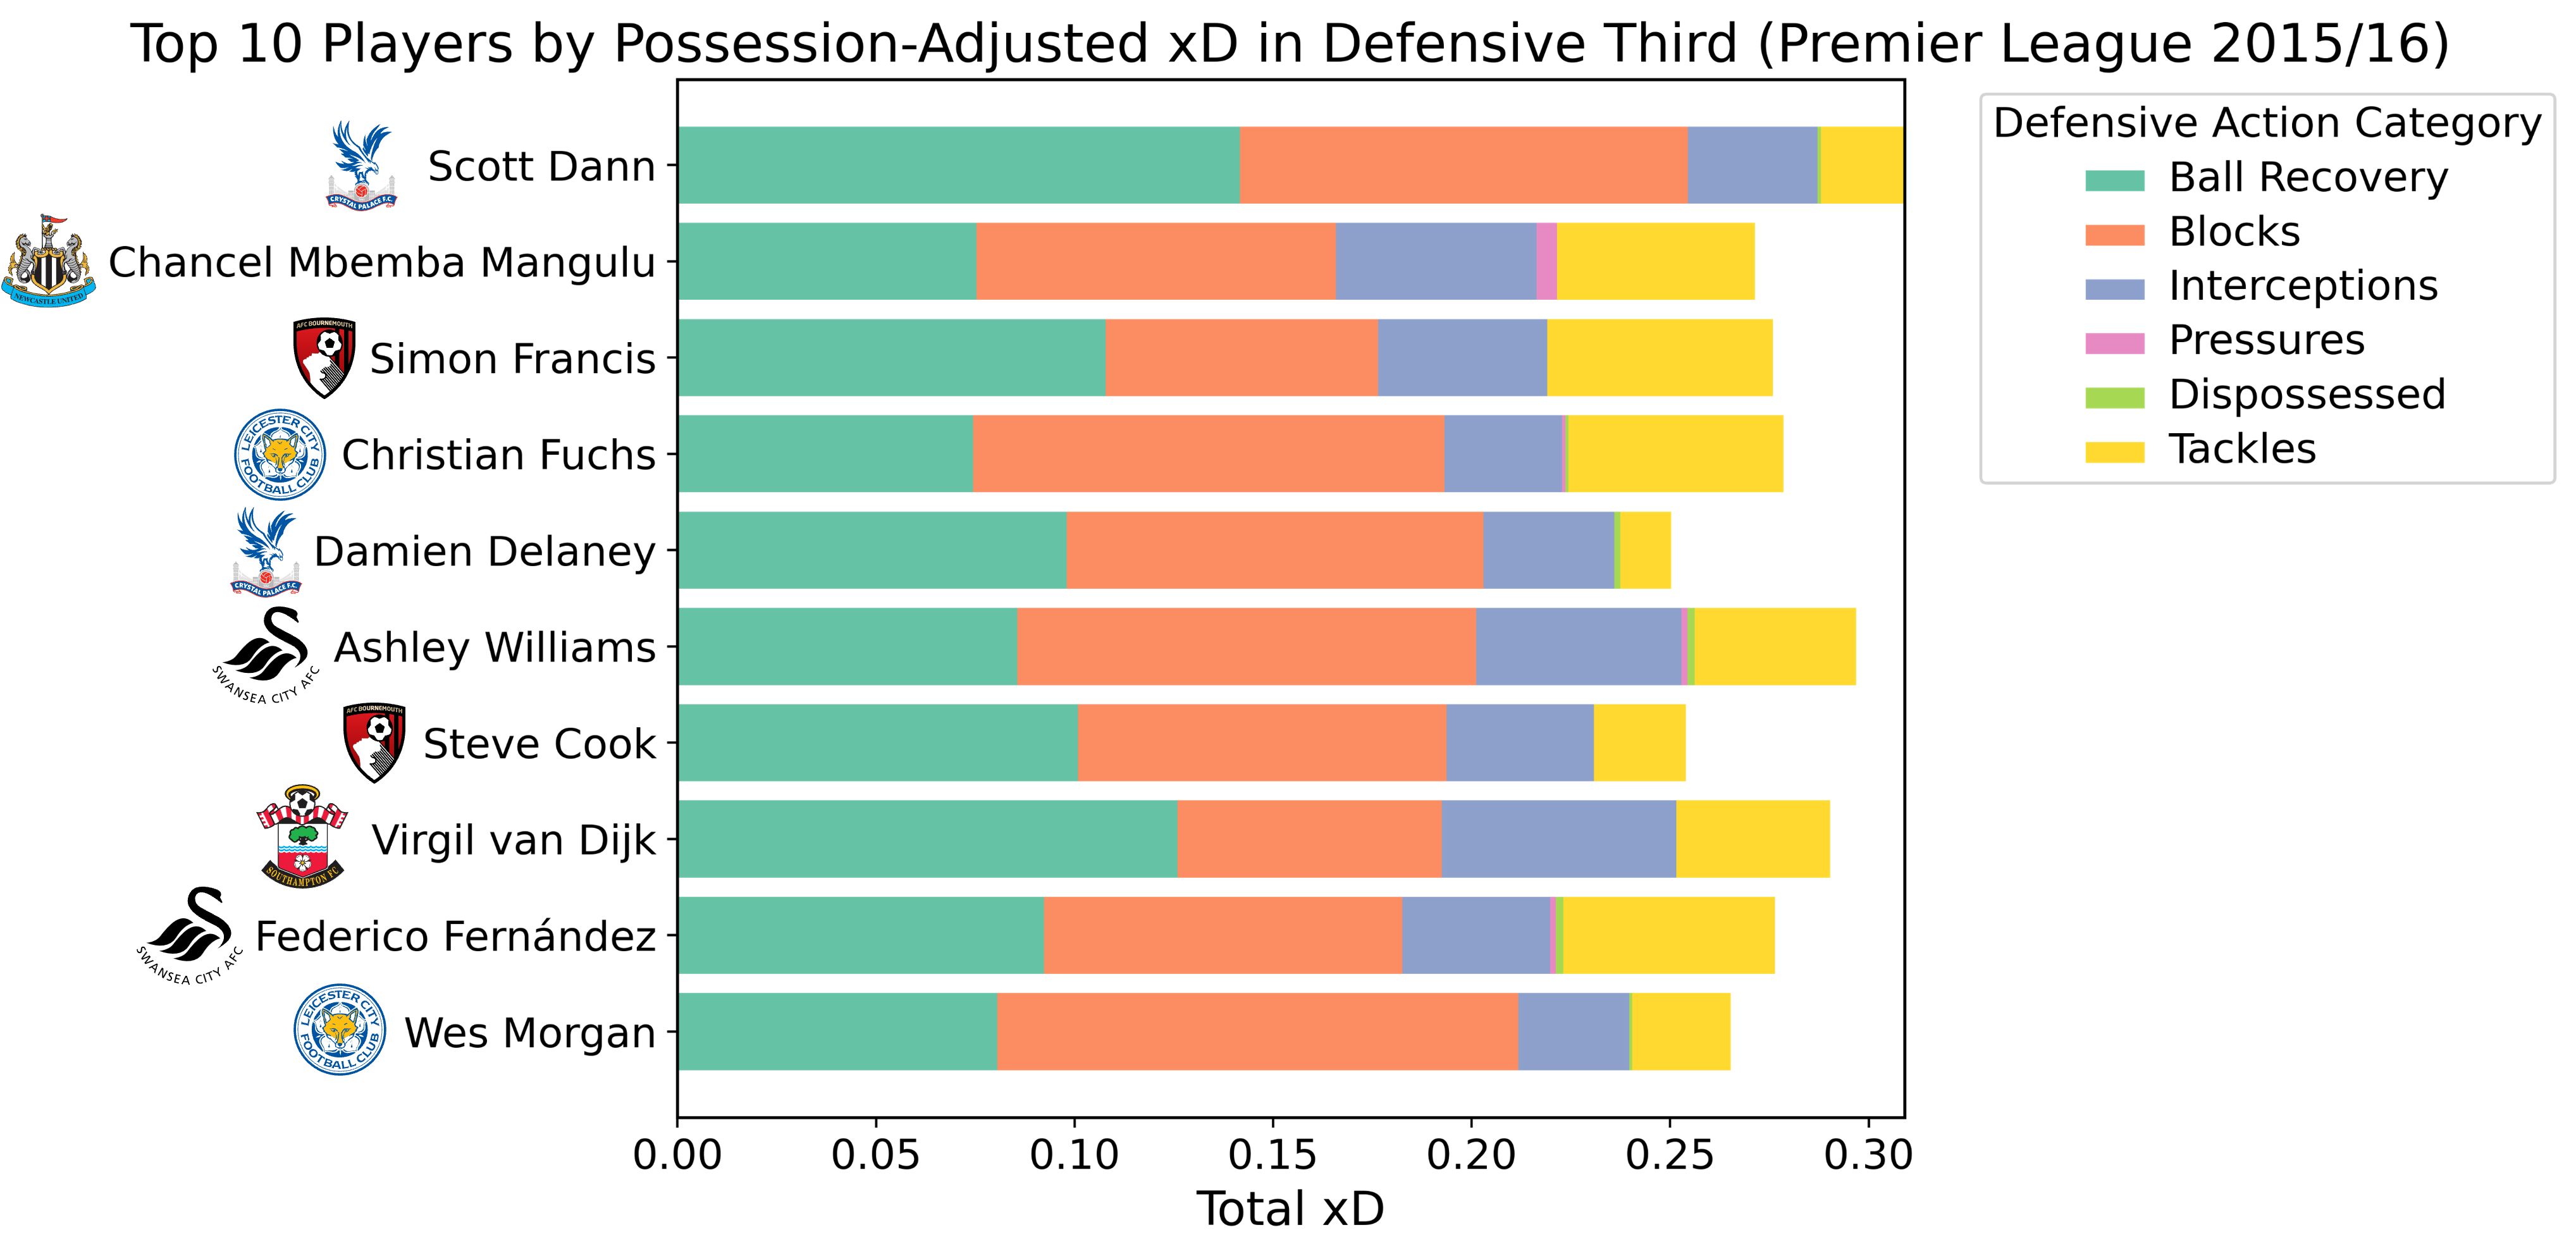
At the top of the possession-adjusted xD rankings in the defensive third is Scott Dann of Crystal Palace. Roughly 46% of his xD came from ball recoveries, while another 37% stemmed from blocks—highlighting his knack for regaining possession and neutralizing threats. These qualities helped Palace avoid relegation trouble and reach the FA Cup final. His performances earned him Palace’s Players’ Player of the Season.
Close behind him is Chancel Mbemba (Newcastle United), who boasts a strong balance of blocks and tackles. Meanwhile, Christian Fuchs and Wes Morgan contribute heavily to Leicester City’s title-winning defense—Fuchs deriving around 12% of his defensive-third xD from blocks and 5% from tackles, Morgan around 13% from blocks plus vital ball recoveries. Their efforts reflect the gritty resilience that underpinned the Foxes’ unexpected triumph.
At Southampton, Virgil van Dijk also shines. Around 40% of his defensive-third xD comes from ball recoveries, and roughly 19% more from interceptions—early signs of the commanding presence he would become at Liverpool, anchoring one of Europe’s most formidable back lines.
Top 10 Players in the Middle Third
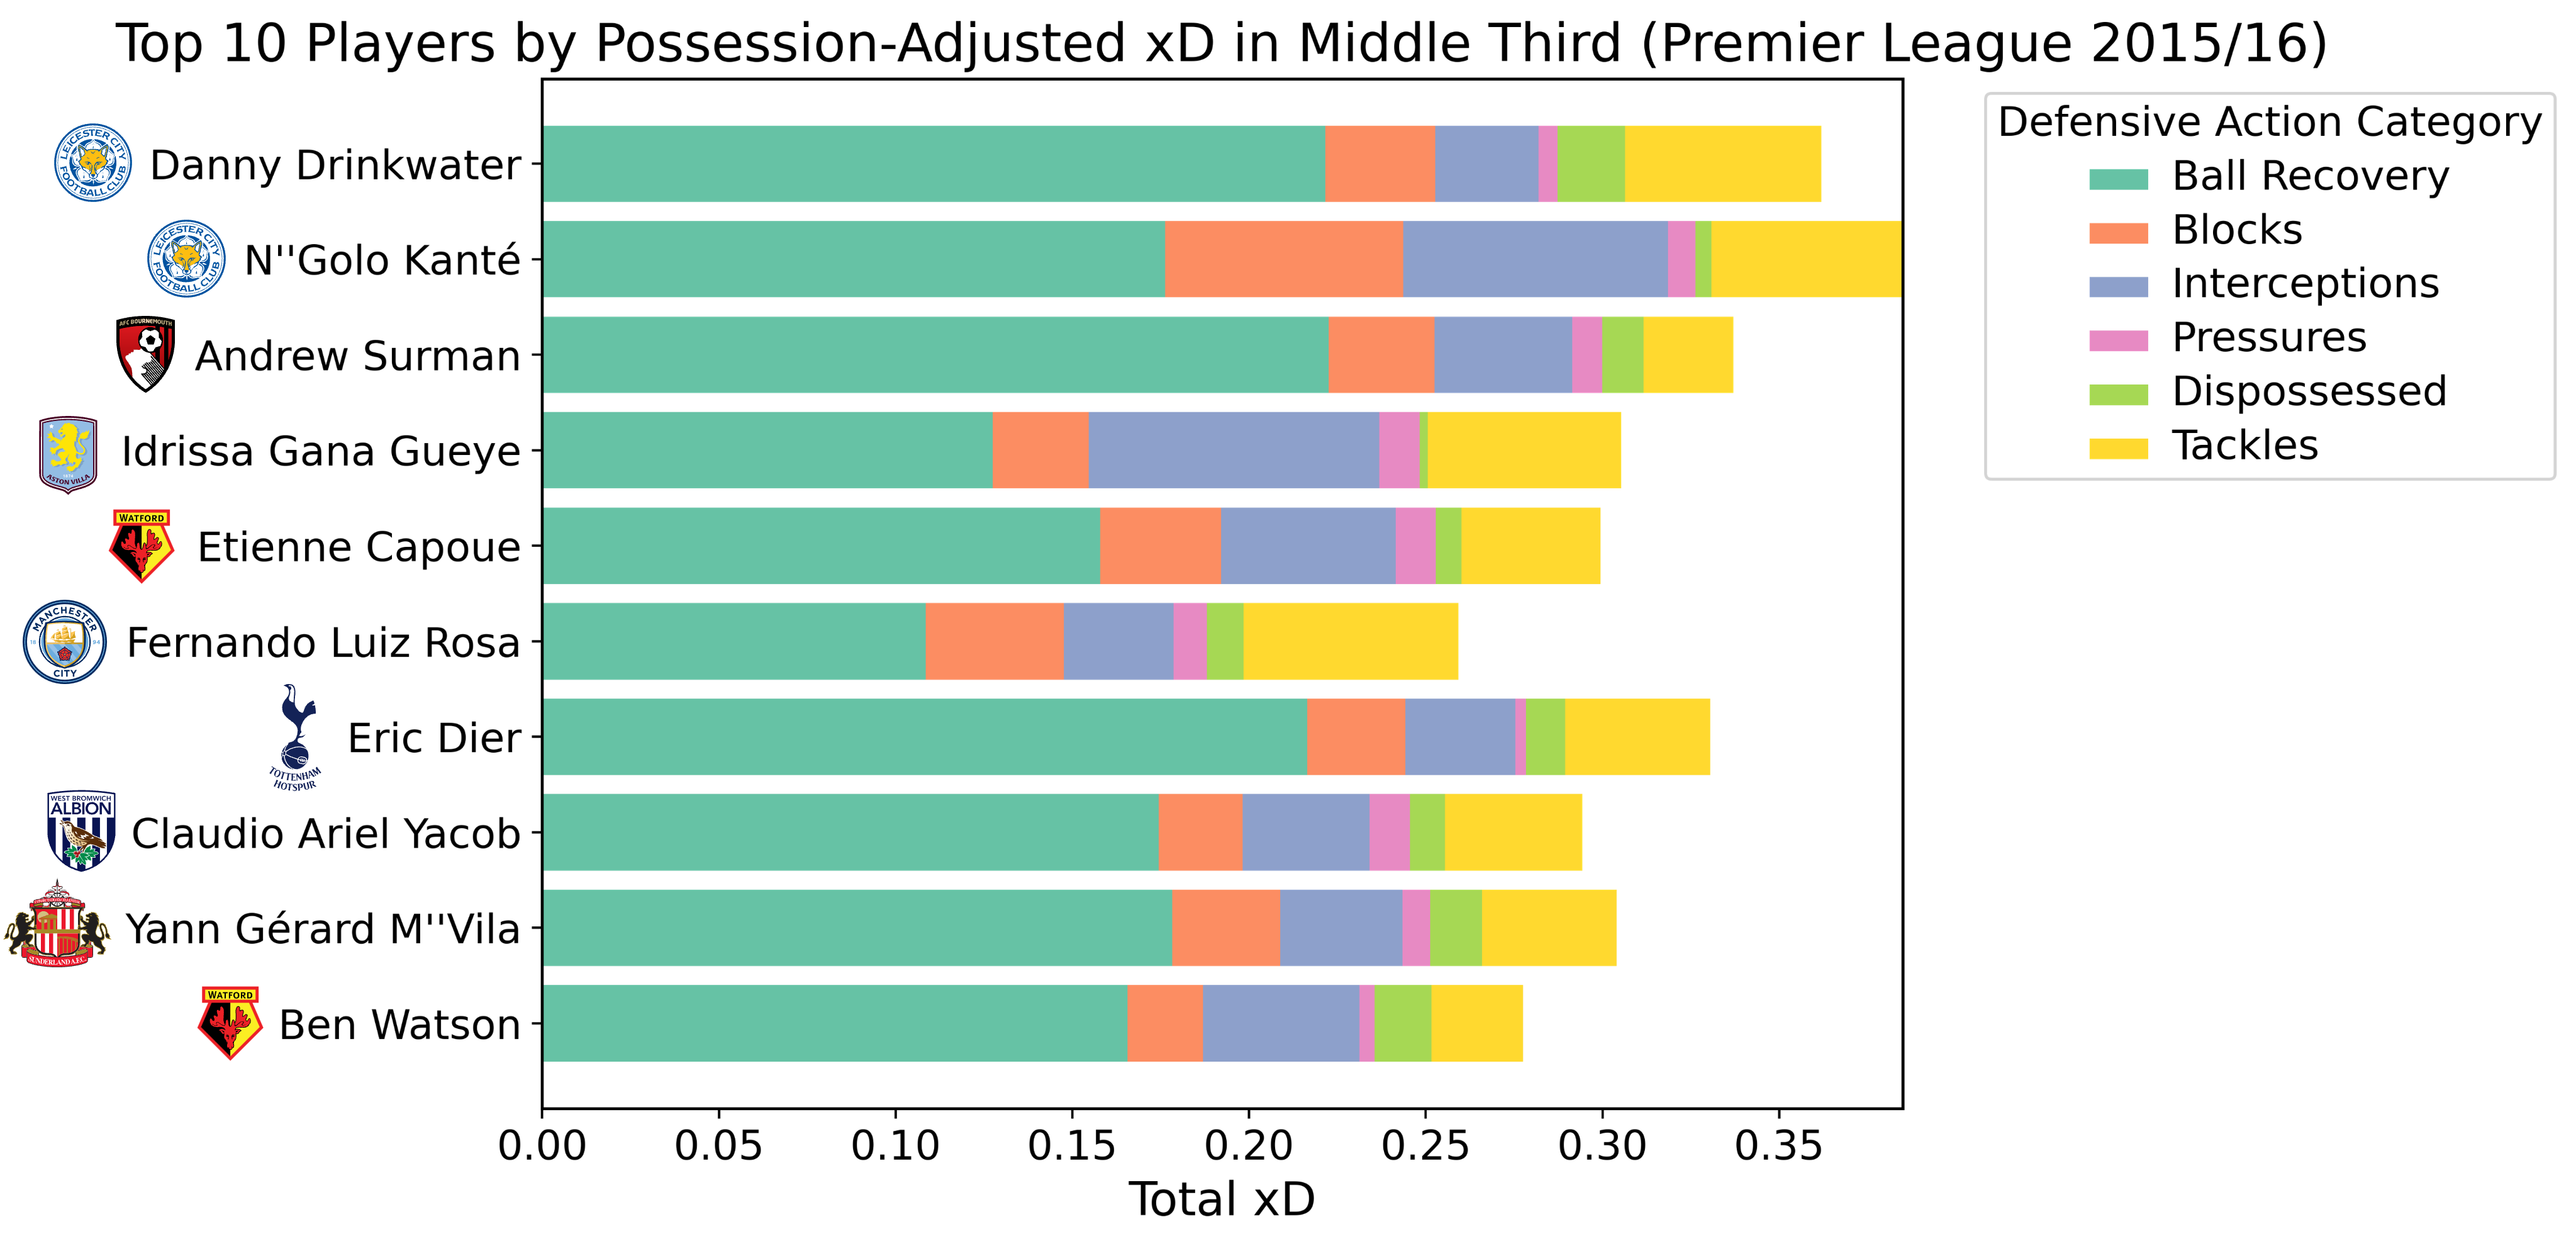
In the middle third, Danny Drinkwater (Leicester City) tops the possession-adjusted xD list. Over half of his total here comes via ball recoveries, alongside steady contributions in tackles and interceptions. Drinkwater’s composure on the ball and aptitude for regaining possession enabled Leicester to switch defense to attack seamlessly.
Just behind him, N’Golo Kanté continues his reputation as a tireless disruptor. Around 46% of his middle-third xD arises from ball recoveries, with notable outputs in blocks and interceptions. Their partnership anchored Leicester’s midfield, giving the Foxes their league-winning counterattacking platform.
AFC Bournemouth’s Andrew Surman shows similar skill in ball recoveries, while Idrissa Gana Gueye (then at Aston Villa) stands out for his interceptions and tackles. Despite Villa’s struggles and eventual relegation that season, Gueye’s standout defensive efforts would soon earn him a deserved move to Everton.
Top 10 Players in the Attacking Third
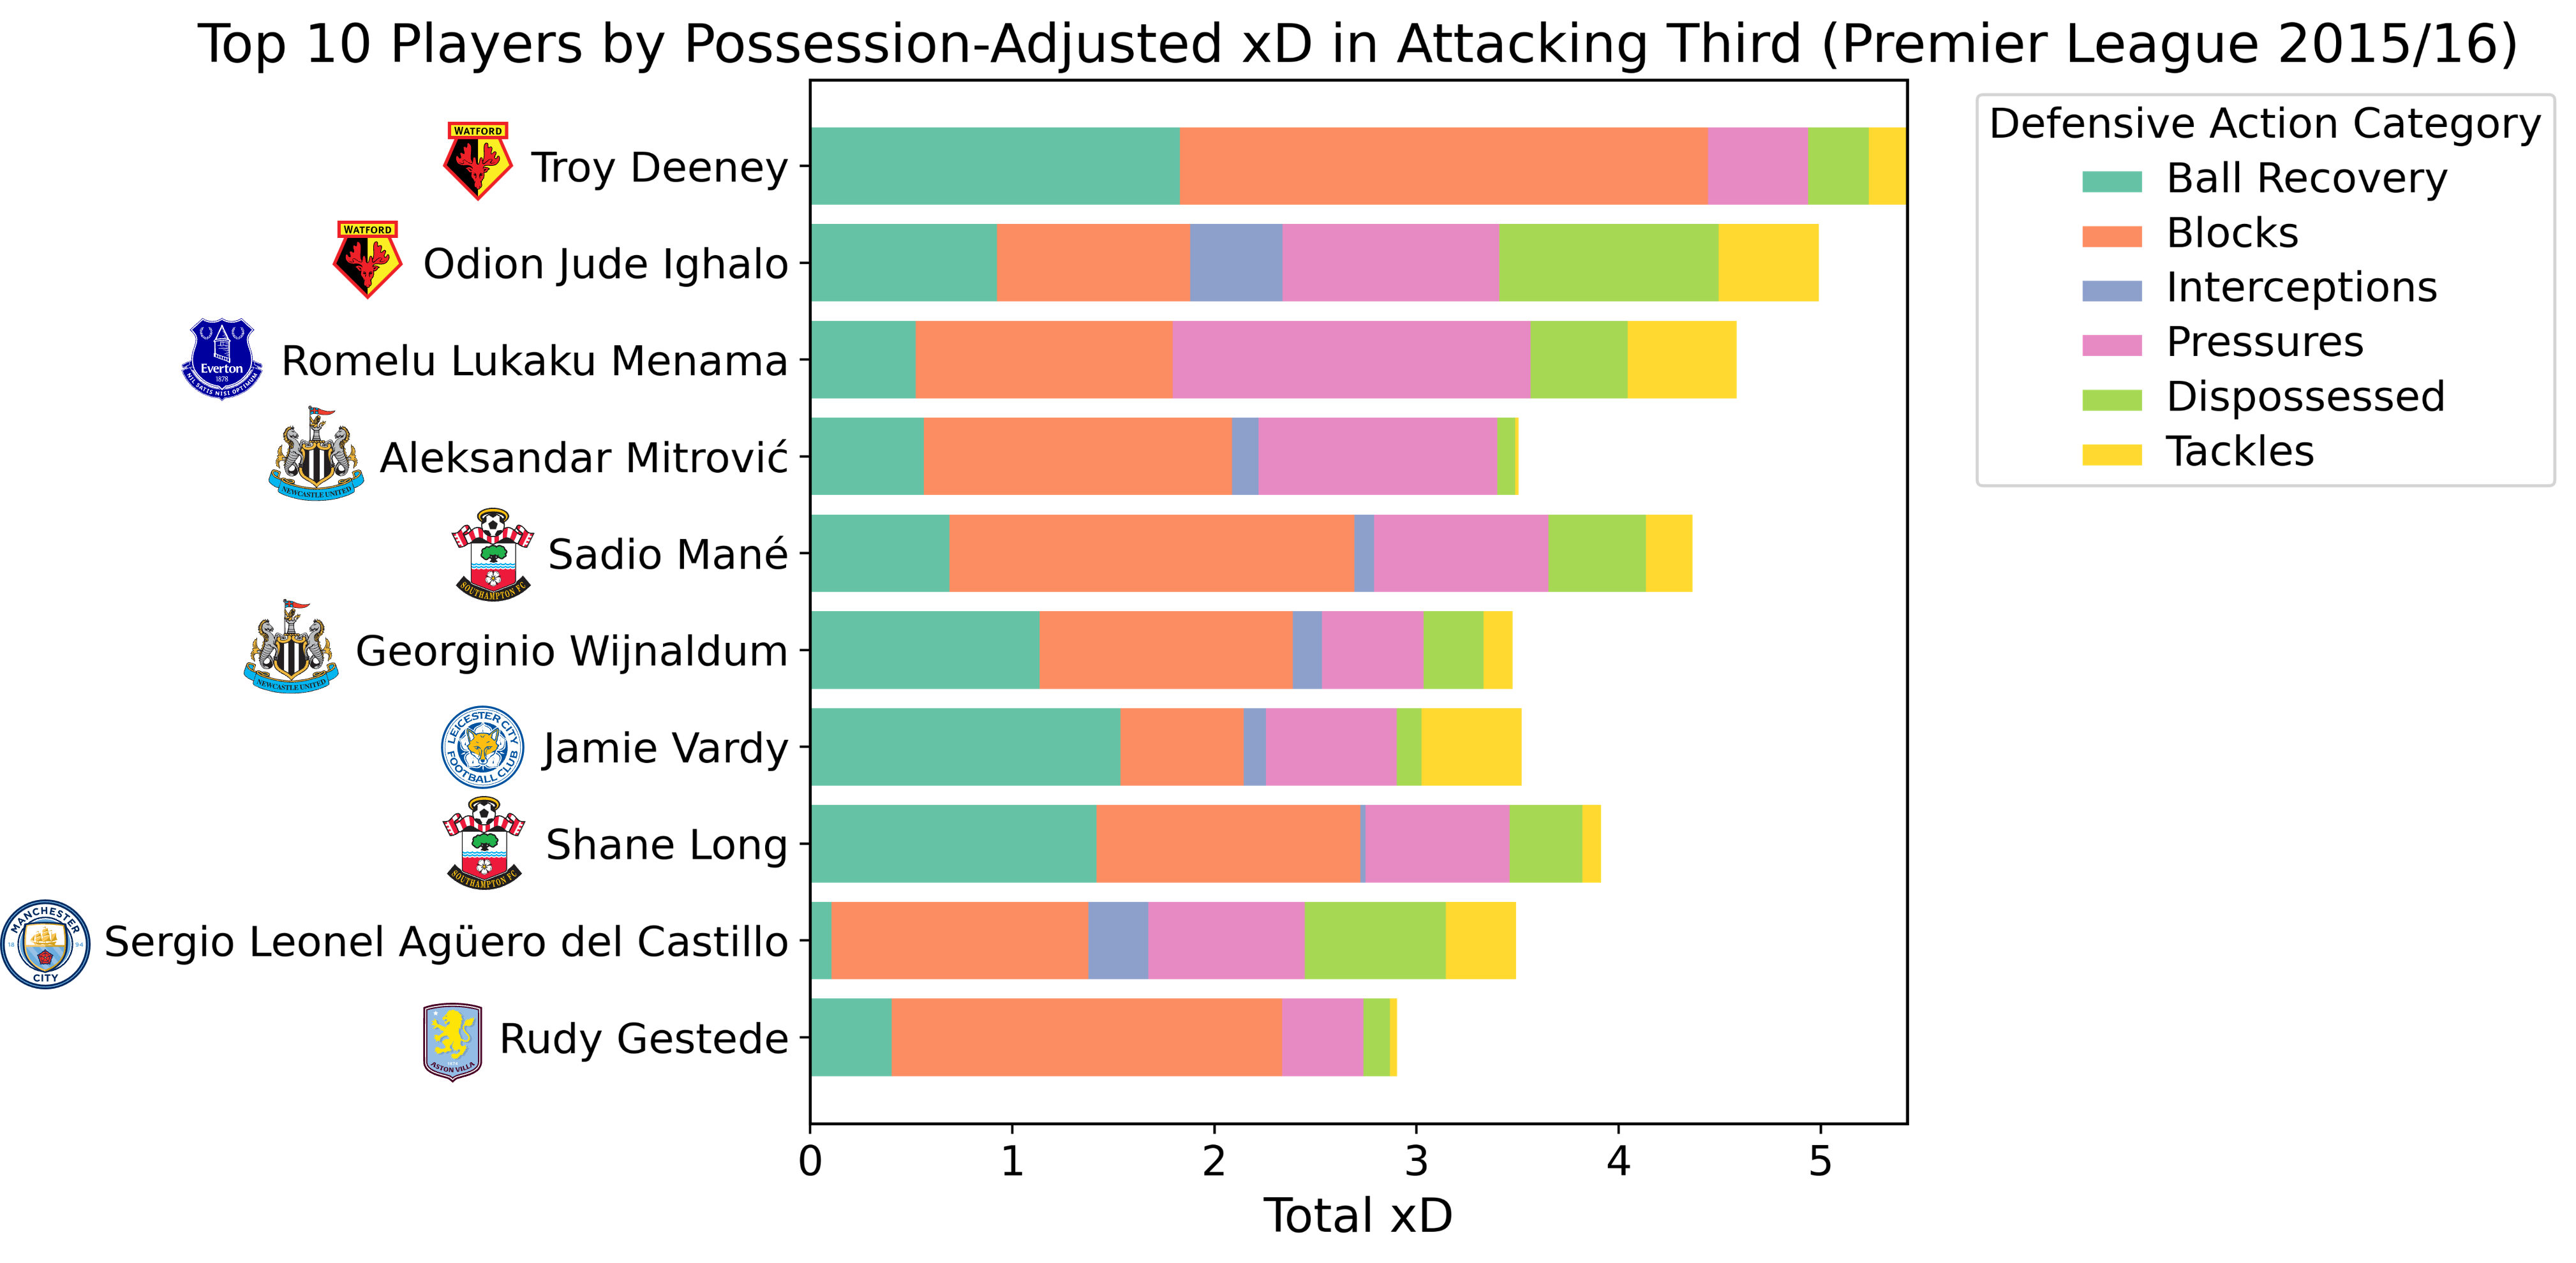
In the attacking third, Troy Deeney (Watford) leads the way in possession-adjusted xD. A remarkable 48% of his total xD comes from blocks, reflecting how actively he hassles opponents at the top of the pitch. Another ~34% stems from ball recoveries, illustrating his ability to reclaim the ball in dangerous areas.
His teammate Odion Ighalo contributes heavily too, with dispossessions and pressures accounting for over 40% of his xD in advanced zones. These qualities made him an attractive option for Ole Gunnar Solskjær, who brought Ighalo to Manchester United as a high-pressing backup striker.
Romelu Lukaku (Everton) also features prominently, with around 28% of his attacking-third xD generated by blocks and 39% by pressures. Meanwhile, Sadio Mané (Southampton) shows his trademark two-way impact—~41% of his xD comes from blocks, plus additional disruption through dispossessions—foreshadowing the relentless, high-octane style that would later define his success at Liverpool.
Leicester’s Year, But Not Theirs Alone
The 2015/2016 season wasn’t just about Leicester’s dream run—it was a stage for players who shaped the game beyond that one magical year. Scott Dann gave Crystal Palace a fighting chance, N’Golo Kanté redefined midfield control, and Troy Deeney showed the value of relentless effort in the attacking third. For some, like Virgil van Dijk and Sadio Mané, this season was a stepping stone to even greater heights.
Mapping the Mark of a Title Winning Team
While individual performances shone brightly, Leicester City’s title-winning campaign was built on a collective ability to disrupt play across every part of the pitch. This dominance is captured in their possession-adjusted xD percentile rank heatmap, a visualization that brings their tactical mastery to life.
Leicester City’s historic 2015/2016 Premier League triumph was rooted in their ability to disrupt opposition play across the pitch, as vividly illustrated by the heatmap.
- Their 92.22 percentile rank in the defensive third highlights how effectively they neutralized threats near their goal.
- In the middle third, their 91.7 percentile rank reflects the disruptive influence of N’Golo Kanté and Danny Drinkwater.
- The attacking third, with an 88.3 percentile rank, demonstrates Leicester’s relentless high pressing.
The heatmap underscores Leicester’s collective ability to disrupt play across all thirds, forming the foundation of their unforgettable title-winning season.
Explore the Defensive Landscape
Now it’s your turn to explore. Use the dropdown menu below to select different Premier League teams and uncover their possession-adjusted xD percentile rank heatmaps. Compare how teams varied in their defensive disruption across the pitch and discover the unique defensive profiles that defined the 2015/2016 season. Remember that these heatmaps reflect possession-adjusted performance. Teams like possession-heavy Manchester City might have less intense activity zones than Leicester but still rank higher overall.
Final Thoughts
The Expected Disruption (xD) model aims to bring greater nuance to evaluating defensive contributions, addressing gaps in traditional metrics by accounting for context (e.g., location, outcome, threat prevented). While it provides meaningful insights, certain limitations remain. Positional and role biases can skew comparisons, as players in different roles naturally face varying defensive opportunities. Furthermore, xD struggles to fully account for contextual factors such as game states or weather, interactions between defenders, and the grading of “near-misses” that influence play without resulting in a recorded disruption. These challenges underscore the complexity of quantifying defensive impact, but they also highlight opportunities for refinement. I welcome your feedback to enhance this framework and further our understanding of the subtle art of defense.