
Principal Component Analysis in Football for Transfer Evaluation
A Statistical Look at Player Transfers and Team Dynamics
Introduction
As transfer fees soar, evaluating whether a player’s style fits a team’s tactics has become critical. Analysts have developed data-driven tools that go beyond goals and assists to assess playing styles and compatibility. For example, Decroos and Davis (2019) introduced player vectors to compare styles and track development, while Pappalardo et al. (2019) created PlayeRank to evaluate players based on their roles and contributions. The Twenty First Group uses advanced models to assess player value and style, aiding smarter transfer decisions.
Player embedding using UMAP by Charles William simplifies large datasets to reveal patterns. Inspired by such methods, I explored whether Principal Component Analysis (PCA) could uncover insights into playing styles and player-team fit. PCA condenses complex metrics into a few dimensions, capturing differences like possession, dribbling, or direct play, offering a starting point for evaluating compatibility.
While tools like PCA highlight trends, they work best alongside traditional scouting to capture tactical and psychological nuances. This analysis uses PCA to examine player-team fit while considering football’s broader complexities.
Why I Use PCA & My Goal
I chose Principal Component Analysis (PCA) as it simplifies complex datasets while uncovering valuable patterns:
- Reduces Complexity: PCA condenses a large set of metrics into just a few principal components—dimensions or axes that represent the most important differences within players or within teams.
- Reveals Patterns: It helps identify similarities and differences. For players, it can show who’s dribble-heavy, who’s a consistent passer, or who leans more on defensive contributions. For teams, it can highlight possession-heavy clubs, direct/counterattacking sides, or set-piece specialists.
Running Two Separate PCAs: Why?
Often, analysts consider one PCA that includes both players and teams in the same dataset. However, this can overshadow the nuances in each group for two main reasons:
-
Different Scale & Scope
Player‐level data typically measures individual events (shots, passes, interceptions), whereas team‐level data aggregates or normalizes metrics across an entire squad. Combining these can warp the principal components if the numerical ranges or distributions for players and teams differ significantly. -
Distinct Nuances
Players diverge in personal strengths (like dribbling, finishing, or defending), while teams diverge in collective shape, possession strategies, or overall style. A single PCA can lose precision by forcing both sets of insights into one reduced space.
By running two PCAs—one for players, one for teams—I give each subset the room to highlight its own most relevant axes (e.g., “Attacking Output” for players vs. “Team Attack + Possession” for clubs). Although these coordinate systems are technically distinct, using thematically similar metrics (xG, progressive passes, dribbles) helps ensure the principal components can capture parallel stylistic concepts—like “attacking vs. defensive” or “possession vs. direct”—in each space.
This approach remains a heuristic, but if the players’ PC1 emphasizes Shots/xG while the teams’ PC1 ties to Shots, xG, and Possession, we gain a conceptually similar “attacking” axis for comparing a player’s coordinate to a team’s coordinate as a measure of “fit.” In the following sections, we’ll see that the scatterplots do indeed reflect these parallels, reinforcing that a high player coordinate on an attacking axis likely corresponds well to a high team coordinate on a similarly attacking axis.
Data & Metrics Overview
How PCA Works
Imagine you’re sorting a massive pile of football stickers with different traits—some are shiny, colorful, big, or small. Instead of focusing on every single detail, PCA helps you find the most important patterns, like grouping stickers into “bright vs. dull” or “big vs. small.” These patterns, called principal components, make it easier to see what really matters.
Now think about football metrics—things like passes, shots, and dribbles. Players and teams each have so many numbers that it’s overwhelming to compare them. By running two PCAs (one for players, one for teams), I reduce these metrics into a set of “biggest differences” for players and another set for teams. For instance:
- The player PCA might highlight who balances dribbling and shooting vs. who focuses on passing.
- The team PCA might highlight who dominates possession vs. who is quicker on the break.
Each PCA produces new coordinates that represent how each player or team fits into those largest patterns of variance in their own dataset.
Metrics I’m Using
For this analysis, I used match event data provided by StatsBomb to evaluate the 2015/2016 season across the top five European leagues—Premier League, Serie A, La Liga, Bundesliga, and Ligue 1. The following 13 metrics were calculated at both the player level and the team level to capture individual and collective styles of play:
- Possession: The percentage of game time the team controlled the ball while the player was on the pitch.
- Pass Completion Rate: The percentage of successful passes out of all passes attempted.
- xG per 90: Expected Goals per 90 minutes, indicating how likely a player’s shots were to result in goals.
- Shots per 90: Total shots attempted per 90 minutes.
- Key Passes per 90: Passes leading directly to a shot per 90 minutes.
- Dribbles per 90: Successful dribbles per 90 minutes.
- Duel Success Rate: The percentage of physical challenges (tackles, aerial duels, etc.) won by the player.
- Interceptions per 90: The number of successful interceptions per 90 minutes.
- Fouls Committed per 90: Total fouls committed per 90 minutes.
- Progressive Passes per 90: Passes that move the ball significantly closer to the opponent’s goal.
- Set Piece xG per 90: Expected Goals from set-piece shots like free kicks and corners, scaled to 90 minutes.
- Player Pass Length Avg: The average length of completed passes (in yards).
- Counterattacks per 90: Shots resulting from counterattacks per 90 minutes.
To account for differences in league strength, all metrics were transformed into percentile ranks. For example, a player in the 90th percentile for xG per 90 performed better than 90% of the players in the dataset. A similar percentile transform was done at the team level.
Building the PCA Spaces
After converting metrics into percentile ranks separately for players and for teams, I ended up with two large matrices:
- Player Matrix: Rows = Players, Columns = 13 metrics (player-focused).
- Team Matrix: Rows = Teams, Columns = 13 metrics (team-focused).
Using PCA on each dataset, I identified the main patterns—called principal components (PCs). Each player thus gets coordinates in “player PCA space,” and each team gets coordinates in “team PCA space.” Although these spaces aren’t mathematically identical, they stem from comparable metrics (possession, xG, passing, etc.), so their principal components often capture similar stylistic ideas (attacking emphasis, passing style, etc.).
Player PCA: Loadings & Explained Variance
Below is a complete table of all 13 metrics (rows) vs. all 13 principal components (columns) for the Player PCA loadings. A positive loading means that metric increases along that PC’s axis, while a negative loading means it decreases.
| Metric | PC1 | PC2 | PC3 | PC4 | PC5 | PC6 | PC7 | PC8 | PC9 | PC10 | PC11 | PC12 | PC13 |
|---|---|---|---|---|---|---|---|---|---|---|---|---|---|
| Possession | -0.0129 | -0.0091 | 0.9725 | 0.1948 | 0.0771 | -0.0884 | 0.0078 | -0.0081 | -0.0386 | 0.0197 | -0.0063 | -0.0040 | -0.0126 |
| Pass Completion Rate | -0.0172 | 0.3086 | -0.1836 | 0.7051 | 0.0189 | -0.4815 | -0.2340 | 0.2710 | -0.0497 | 0.0792 | -0.0597 | 0.0295 | -0.0096 |
| Player Pass Length Avg | -0.2771 | 0.2628 | 0.0171 | -0.3813 | 0.4478 | -0.1944 | 0.0317 | 0.1430 | 0.0799 | 0.2696 | -0.6065 | -0.0175 | 0.0370 |
| Progressive Passes per 90 | -0.1081 | 0.4813 | 0.0555 | -0.4059 | 0.1461 | -0.2064 | -0.2443 | 0.0727 | -0.1565 | -0.0303 | 0.6584 | 0.0329 | 0.0058 |
| xG per 90 | 0.4278 | -0.0343 | -0.0283 | 0.0253 | 0.2920 | -0.1284 | 0.1840 | -0.0773 | -0.0654 | 0.0001 | 0.0625 | -0.0038 | 0.8152 |
| Shots per 90 | 0.4341 | 0.0183 | -0.0090 | -0.0631 | 0.1568 | -0.0951 | 0.1541 | -0.0127 | -0.0821 | 0.0279 | -0.0412 | 0.7937 | -0.3323 |
| Key Passes per 90 | 0.3319 | 0.1933 | 0.0548 | -0.2262 | -0.3270 | -0.1509 | -0.2400 | -0.0340 | -0.4258 | -0.4858 | -0.4060 | -0.1657 | -0.0166 |
| Duel Success Rate | -0.0920 | 0.4206 | 0.0192 | 0.0039 | -0.3657 | -0.1076 | 0.8062 | 0.0903 | 0.0529 | -0.0744 | 0.0259 | -0.0412 | 0.0092 |
| Interceptions per 90 | 0.0525 | 0.4922 | 0.0131 | 0.1618 | 0.1276 | 0.2798 | -0.1621 | -0.4605 | 0.5294 | -0.3149 | -0.0953 | 0.0789 | 0.0301 |
| Counterattacks per 90 | 0.3343 | -0.1332 | 0.0714 | -0.2121 | -0.1219 | -0.1952 | -0.0972 | 0.5337 | 0.6619 | -0.1424 | 0.0429 | -0.1076 | -0.0372 |
| Set Piece xG per 90 | 0.3903 | 0.0078 | -0.0674 | 0.0730 | 0.4523 | -0.0930 | 0.2326 | -0.1663 | -0.0595 | 0.0210 | 0.1028 | -0.5549 | -0.4693 |
| Fouls Committed per 90 | 0.2087 | 0.3019 | 0.0332 | 0.1134 | 0.0967 | 0.7030 | -0.0341 | 0.5350 | -0.2004 | 0.1276 | -0.0315 | -0.0493 | 0.0214 |
| Dribbles per 90 | 0.3325 | 0.1923 | 0.0438 | -0.0982 | -0.4197 | -0.0272 | -0.1685 | -0.2730 | 0.0892 | 0.7357 | -0.0379 | -0.1018 | 0.0058 |
Variance Explained by Each Player PC:
PC1: 35.62%, PC2: 19.37%, PC3: 7.73%, PC4: 7.31%, PC5: 6.91%, PC6: 6.00%, PC7: 4.48%, PC8: 3.69%, PC9: 3.45%, PC10: 2.38%, PC11: 1.81%, PC12: 0.86%, PC13: 0.38%.
Understanding Player Styles with Principal Component Analysis (PCA)
Let’s break down how to interpret the results of a PCA, focusing on the “loadings” of each statistic on the different “principal components” (PCs). Each PC is essentially a new, combined variable that represents a particular aspect of a player’s style. The loadings tell us how strongly each original statistic contributes to that PC, and whether the relationship is positive or negative.
Example: PC1 - The Attacking Force
Let’s look at PC1 from our player analysis. We see that xG per 90, shots per 90, key passes per 90, counterattacks per 90, set piece xG per 90, and dribbles per 90 all have relatively large positive loadings. This suggests that PC1 represents a player’s “attacking output” or “offensive involvement.” Players who score high on PC1 are likely to have high values for these offensive stats, indicating a direct, goal-oriented style.
Example: PC3 - The Possession Maestro
In contrast, PC3 shows a very high positive loading for possession (0.9725). This strongly suggests that PC3 captures a player’s tendency to be heavily involved in possession, likely playing for a team that dominates the ball.
The Importance of Negative Loadings: Identifying Contrasts and Trade-offs
It’s crucial to note that some metrics might have negative loadings on a PC. This doesn’t mean they are unimportant; rather, it indicates an inverse relationship. For example, if a player scores high on a PC with a negative loading for average pass length, they likely make shorter passes on average.
When a principal component has both positive and negative loadings, it often represents a contrast or a trade-off between different playing styles or characteristics.
Example: PC1 - Direct Attackers vs. Deep-Lying Playmakers
In the player data, PC1 could be interpreted as contrasting “direct, goal-oriented attackers” (high shots, xG, key passes) with players who are more involved in build-up play from deeper positions and make longer passes on average.
Example: PC2 - The All-Around Contributor
PC2 presents an interesting case. It has high positive loadings for progressive passes per 90 (0.4813), duel success rate (0.4206), and interceptions per 90 (0.4922), but a negative loading for set piece xG per 90 (-0.0674). This suggests that PC2 might represent well-rounded players who contribute effectively across various aspects of the game – progressing the ball, winning duels, and intercepting passes – but are less specialized in set-piece situations.
Using PCA for Player Comparisons and Transfer Matching
By understanding what each PC represents, we can start to profile players based on their scores on these components. This allows for insightful comparisons and can be used to assess potential transfer targets. For example, if a team is looking for a player who excels in a particular area (e.g., a high scorer on the “attacking output” component), they can use PCA to identify players who fit that profile. If a player is far from a team on a component that loads heavily on, say, “possession,” it suggests the player might not fit well into a possession-based team. In the following section, we’ll explore the results of a team-level PCA, where the loadings and principal components imply similar concepts, but applied to overall team style rather than individual player characteristics.
Team PCA: Loadings & Explained Variance
Below is the complete table of all 13 team metrics vs. the 13 principal components in the Team PCA:
| Metric | PC1 | PC2 | PC3 | PC4 | PC5 | PC6 | PC7 | PC8 | PC9 | PC10 | PC11 | PC12 | PC13 |
|---|---|---|---|---|---|---|---|---|---|---|---|---|---|
| Team Possession | 0.3595 | 0.1395 | -0.2243 | -0.0980 | 0.0686 | 0.2251 | -0.1350 | -0.0853 | 0.1875 | -0.3555 | -0.1057 | 0.7320 | -0.0439 |
| Team Pass Completion Rate | 0.3288 | 0.1814 | -0.3687 | 0.0867 | 0.0471 | 0.0569 | -0.1312 | 0.1739 | 0.2824 | -0.4046 | 0.3212 | -0.5356 | 0.1707 |
| Team Pass Len Avg | -0.2581 | -0.2575 | 0.1067 | -0.4330 | 0.0948 | -0.4301 | -0.1876 | 0.4452 | 0.4493 | -0.1652 | -0.0650 | 0.0864 | -0.0009 |
| Team Progressive Passes per 90 | 0.3199 | 0.0519 | -0.1990 | -0.3776 | 0.1362 | -0.1414 | -0.3545 | -0.4075 | 0.1583 | 0.4641 | -0.3004 | -0.2222 | -0.0506 |
| Team xG per 90 | 0.3204 | -0.2765 | 0.2307 | -0.1499 | -0.0115 | 0.1452 | -0.3261 | 0.1781 | -0.1691 | 0.2866 | 0.6685 | 0.1361 | -0.0984 |
| Team Shots per 90 | 0.3326 | -0.3121 | 0.0581 | -0.0990 | 0.1381 | -0.1703 | 0.4314 | -0.0779 | -0.0286 | 0.0493 | 0.0010 | 0.0855 | 0.7266 |
| Team Key Passes per 90 | 0.3358 | -0.2474 | -0.0372 | -0.1195 | 0.0724 | -0.1775 | 0.5639 | -0.0678 | 0.0415 | -0.1263 | 0.0464 | -0.1054 | -0.6482 |
| Team Duel Success Rate | 0.2381 | 0.3486 | -0.0218 | 0.1573 | 0.4645 | -0.3839 | -0.0730 | 0.4389 | -0.4467 | 0.0710 | -0.1533 | 0.0668 | -0.0541 |
| Team Interceptions per 90 | -0.0495 | 0.4201 | 0.5582 | -0.3986 | 0.2234 | -0.0213 | 0.0250 | -0.3478 | -0.0995 | -0.3515 | 0.1811 | -0.1052 | 0.0366 |
| Team Counterattacks per 90 | 0.1566 | -0.2185 | 0.4535 | 0.6135 | 0.3110 | -0.0705 | -0.2197 | -0.1855 | 0.3775 | -0.0508 | -0.1083 | -0.0245 | -0.0619 |
| Team Set Piece xG per 90 | 0.2898 | -0.3024 | 0.2461 | -0.1185 | -0.3294 | 0.1742 | -0.2466 | 0.1582 | -0.3573 | -0.3486 | -0.4766 | -0.2212 | 0.0047 |
| Team Fouls Committed per 90 | -0.2167 | -0.2635 | -0.1175 | -0.1628 | 0.6701 | 0.5889 | 0.0489 | 0.1079 | -0.0623 | -0.0044 | -0.1134 | -0.1272 | -0.0207 |
| Team Dribbles per 90 | 0.2302 | 0.3702 | 0.3358 | -0.0754 | -0.1452 | 0.3599 | 0.2754 | 0.4137 | 0.3788 | 0.3376 | -0.1846 | -0.0481 | 0.0072 |
Variance Explained by Each Team PC:
PC1: 46.27%, PC2: 14.83%, PC3: 9.76%, PC4: 6.80%, PC5: 5.64%, PC6: 4.51%, PC7: 3.73%, PC8: 3.02%, PC9: 2.92%, PC10: 1.04%, PC11: 0.82%, PC12: 0.52%, PC13: 0.13%.
Despite running separate PCA models for players and teams, similar stylistic themes emerge in both datasets. By mapping specific Principal Components (PCs) for players to those for teams, we create a common stylistic language that helps highlight potential fits for transfers or tactical alignments.
Similar Stylistic Concepts in Player & Team Analyses
Below are the four key themes we focus on when calculating distances between a player and a team. Each theme corresponds to a specific PC in the player dataset and a corresponding PC in the team dataset.
| Theme | What It Means | Players PC# & Var % Key Loadings |
Teams PC# & Var % Key Loadings |
|---|---|---|---|
| Attacking | Goal-oriented play (shots, xG) |
PC1 (35.62%) • xG per 90 (+0.428) • Shots per 90 (+0.434) • Key Passes (+0.332) • Counterattacks (+0.334) | PC1 (46.27%) • Team xG per 90 (+0.3204) • Team Shots per 90 (+0.3326) • Team Key Passes (+0.3358) • Team Possession (+0.3595) |
| Possession | High ball control (short passing) |
PC3 (7.73%) • Possession (+0.973) | PC3 (9.76%) • Team Possession (+0.2243) • Team Pass Completion Rate (−0.3687) (negative suggests riskier passes) |
| **Defensive** | Physical/defensive play (duels, interceptions) |
PC2 (19.37%) • Duel Success Rate (+0.4206) • Interceptions (+0.4922) | PC2 (14.83%) • Team Duel Success Rate (+0.3486) • Team Interceptions (+0.4201) |
| **Directness** | Vertical approach (longer passing) |
PC5 (6.91%) • Player Pass Length Avg (+0.448) | PC4 (6.80%) • Team Pass Length Avg (−0.433) (negative => lower PC score = longer passes) |
Note: The positive or negative in parentheses indicates how each metric relates to increasing or decreasing PC scores.
Why These Four Themes?
- They represent the core contrasts (attacking emphasis, possession, defensive/physicality, and directness) appearing in both the player and team PCA solutions.
- By matching each player’s PC scores to the corresponding team’s PC scores along these themes, we ensure “like for like” comparisons.
How the Distance Is Computed
We take the four PC scores for a player and the four PC scores for a team, then calculate:
Distance = √( (pAttacking - tAttacking)² + (pPossession - tPossession)² + (pDefensive - tDefensive)² + (pDirectness - tDirectness)²)
A smaller distance means closer alignment between how a player and a team perform on these four stylistic dimensions. By aligning just these four components from each PCA, we get a unified stylistic space that is more interpretable and directly relevant for transfer fit or tactical matching—helping clubs and analysts pinpoint players who will mesh well with a team’s playing style.
Thematic Interpretation of Principal Components (FYI)
Although we will focus on the four PC scores mentioned, below is a concise, side-by-side thematic interpretation of each Principal Component (PC) for Players vs. Teams, based on which metrics load most heavily. Each bullet corresponds to one PC (PC1 through PC13).
PC1:
- Player Theme: High loadings on xG, shots, key passes, dribbles, set‐piece xG → overall attacking output and goal threat.
- Team Theme: High loadings on possession, pass completion, xG, shots, key passes → a strong, possession‐based attacking identity.
PC2:
- Player Theme: Emphasis on progressive passes, duel success, interceptions → two‐way midfield influence (winning the ball + progressing it).
- Team Theme: Emphasis on interceptions, dribbles, duel success (negatively on shots/xG) → more pressing/ball‐winning style rather than all‐out attack.
PC3:
- Player Theme: Dominated by individual possession share → players who see a lot of the ball or orchestrate play.
- Team Theme: Strong positive on interceptions and counterattacks (negative on pass accuracy) → defensive solidity + quick transitions vs. patient build‐up.
PC4:
- Player Theme: High pass completion and negative progressive passes, pass length → safe, shorter passing vs. more direct risk‐taking.
- Team Theme: High on counterattacks but negative on progressive passing → direct countering approach vs. patient progressive buildup.
PC5:
- Player Theme: Positive on longer passing, set‐piece xG and negative on dribbles, key passes → more reliance on long balls or set plays than on open‐play creativity.
- Team Theme: Positive on physical/fouling tendency (fouls + duels) vs. negative on certain set‐piece or technical traits → more rugged style vs. set‐piece focus.
PC6:
- Player Theme: High on fouls committed and negative on pass completion → a more physical, possibly aggressive style that sacrifices accuracy.
- Team Theme: Similar tilt toward fouls committed, somewhat negative on longer passes → a physically intense approach, less about direct “hit‐and‐hope.”
PC7:
- Player Theme: Very high duel success, negative on progressive/key passes → defensive solidity in challenges vs. creative passing.
- Team Theme: High key passes but negative on progressive passes → chance creation via incisive final balls vs. more patient progressive build.
PC8:
- Player Theme: High fouls committed vs. negative interceptions, dribbles → aggressive in stopping play rather than winning the ball cleanly or dribbling.
- Team Theme: Mixed signals—positive pass length, duel success, dribbles vs. negative on progressive passes/interceptions → direct duels/dribble approach vs. intercept‐and‐pass method.
PC9:
- Player Theme: Strong counterattacks vs. negative key passes → more breakaway/transition style than build‐up creativity.
- Team Theme: Emphasis on directness + dribbles over neat interplay/xG → fairly direct, individual carrying rather than refined passing.
PC10:
- Player Theme: High dribbles vs. negative key passes → ball‐carrying specialists who may not thread the final pass as often.
- Team Theme: High progressive passes vs. negative on certain defensive stats → a team relying heavily on forward passing rather than set‐piece or intercept‐based play.
PC11:
- Player Theme: High progressive passes vs. negative long pass length → direct forward balls on the ground instead of lofted or set‐piece reliance.
- Team Theme: High open‐play xG vs. negative set‐piece xG → producing chances in open play rather than depending on dead balls.
PC12:
- Player Theme: High on shots per 90 vs. negative on set‐piece xG → lots of open‐play shooting, less set‐piece reliance.
- Team Theme: Positive on possession vs. negative on pass completion → teams that hold the ball a lot but may force riskier passes, lowering accuracy.
PC13:
- Player Theme: High xG per 90 with relatively fewer shots or set‐piece involvement → players generating quality chances with fewer attempts.
- Team Theme: Positive on shots but negative on key passes → teams that shoot often but do not necessarily rely on intricate final‐ball creativity.
Visualizing the PCA Results
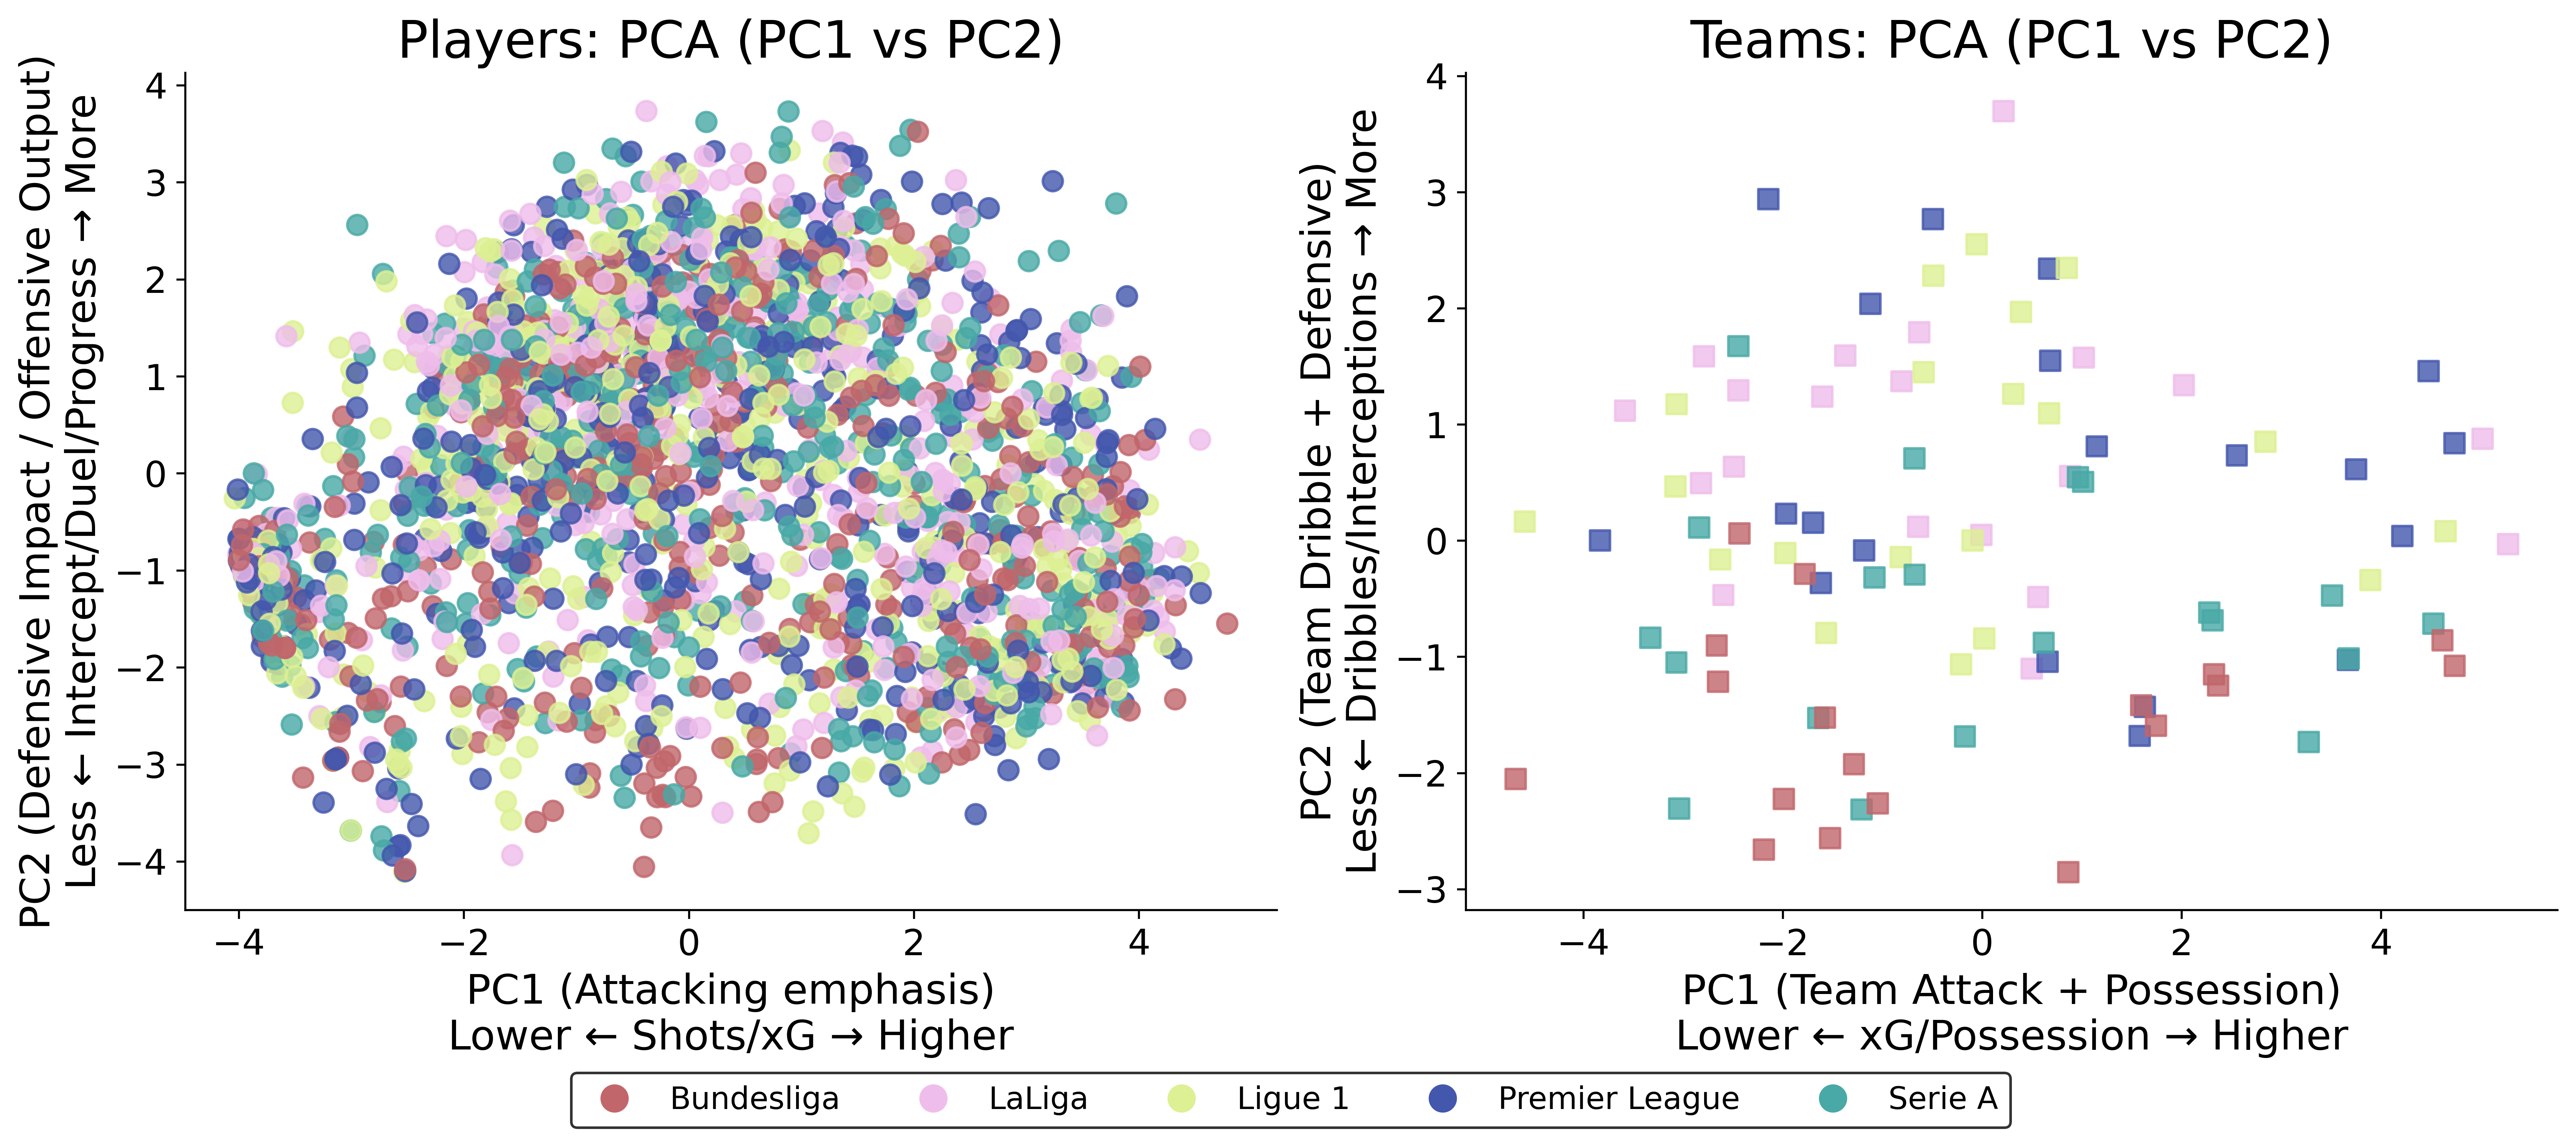
The first two PCs capture 55% of the variance in players and 61% in teams. Therefore the player and team coordinates derived from these first two PCs can be put in a scatterplot to visualize underlying stylistic similarities, as seen above.
- Left Subplot (Player PCA): Each player’s style is mapped onto two axes:
- PC1 (Attacking Emphasis): Players on the right generate more shots/xG, while those on the left produce less.
- PC2 (Defensive Impact + Offensive Output): Players higher on this axis perform more interceptions/duels and also attempt more progressive passes, while those lower do less of both.
- Right Subplot (Team PCA): Each team’s style is mapped onto a different, team‐specific set of axes:
- PC1 (Team Attack + Possession): Teams on the right generate higher xG/possession, whereas teams on the left rely less on sustained attacking/possession.
- PC2 (Team Dribble + Defensive): Teams higher on this axis emphasize dribbling and defensive duels/interceptions, while those lower show fewer dribbles/defensive actions.
Because we run two distinct PCAs (one for players, one for teams), the points in each subplot reflect different coordinate systems. Nonetheless, each pair of principal components reveals corresponding stylistic themes—like “attacking vs. conservative” or “possession vs. direct.”
Highlighted Examples
Let’s look at two specific examples on the two PCA scatterplots (see below). We choose Gareth McAuley, who played as a Center Back for West Bromwich Albion in the 2015/2016 season—a campaign where West Brom, under Tony Pulis, secured a mid-table finish (14th) in the Premier League with their trademark defensive solidity. On the other hand, we have Gerard Piqué, also playing as a Center Back for Barcelona in the 2015/2016 season, which ended with Barcelona winning the La Liga title on the final matchday, edging out Real Madrid in a tightly contested race.
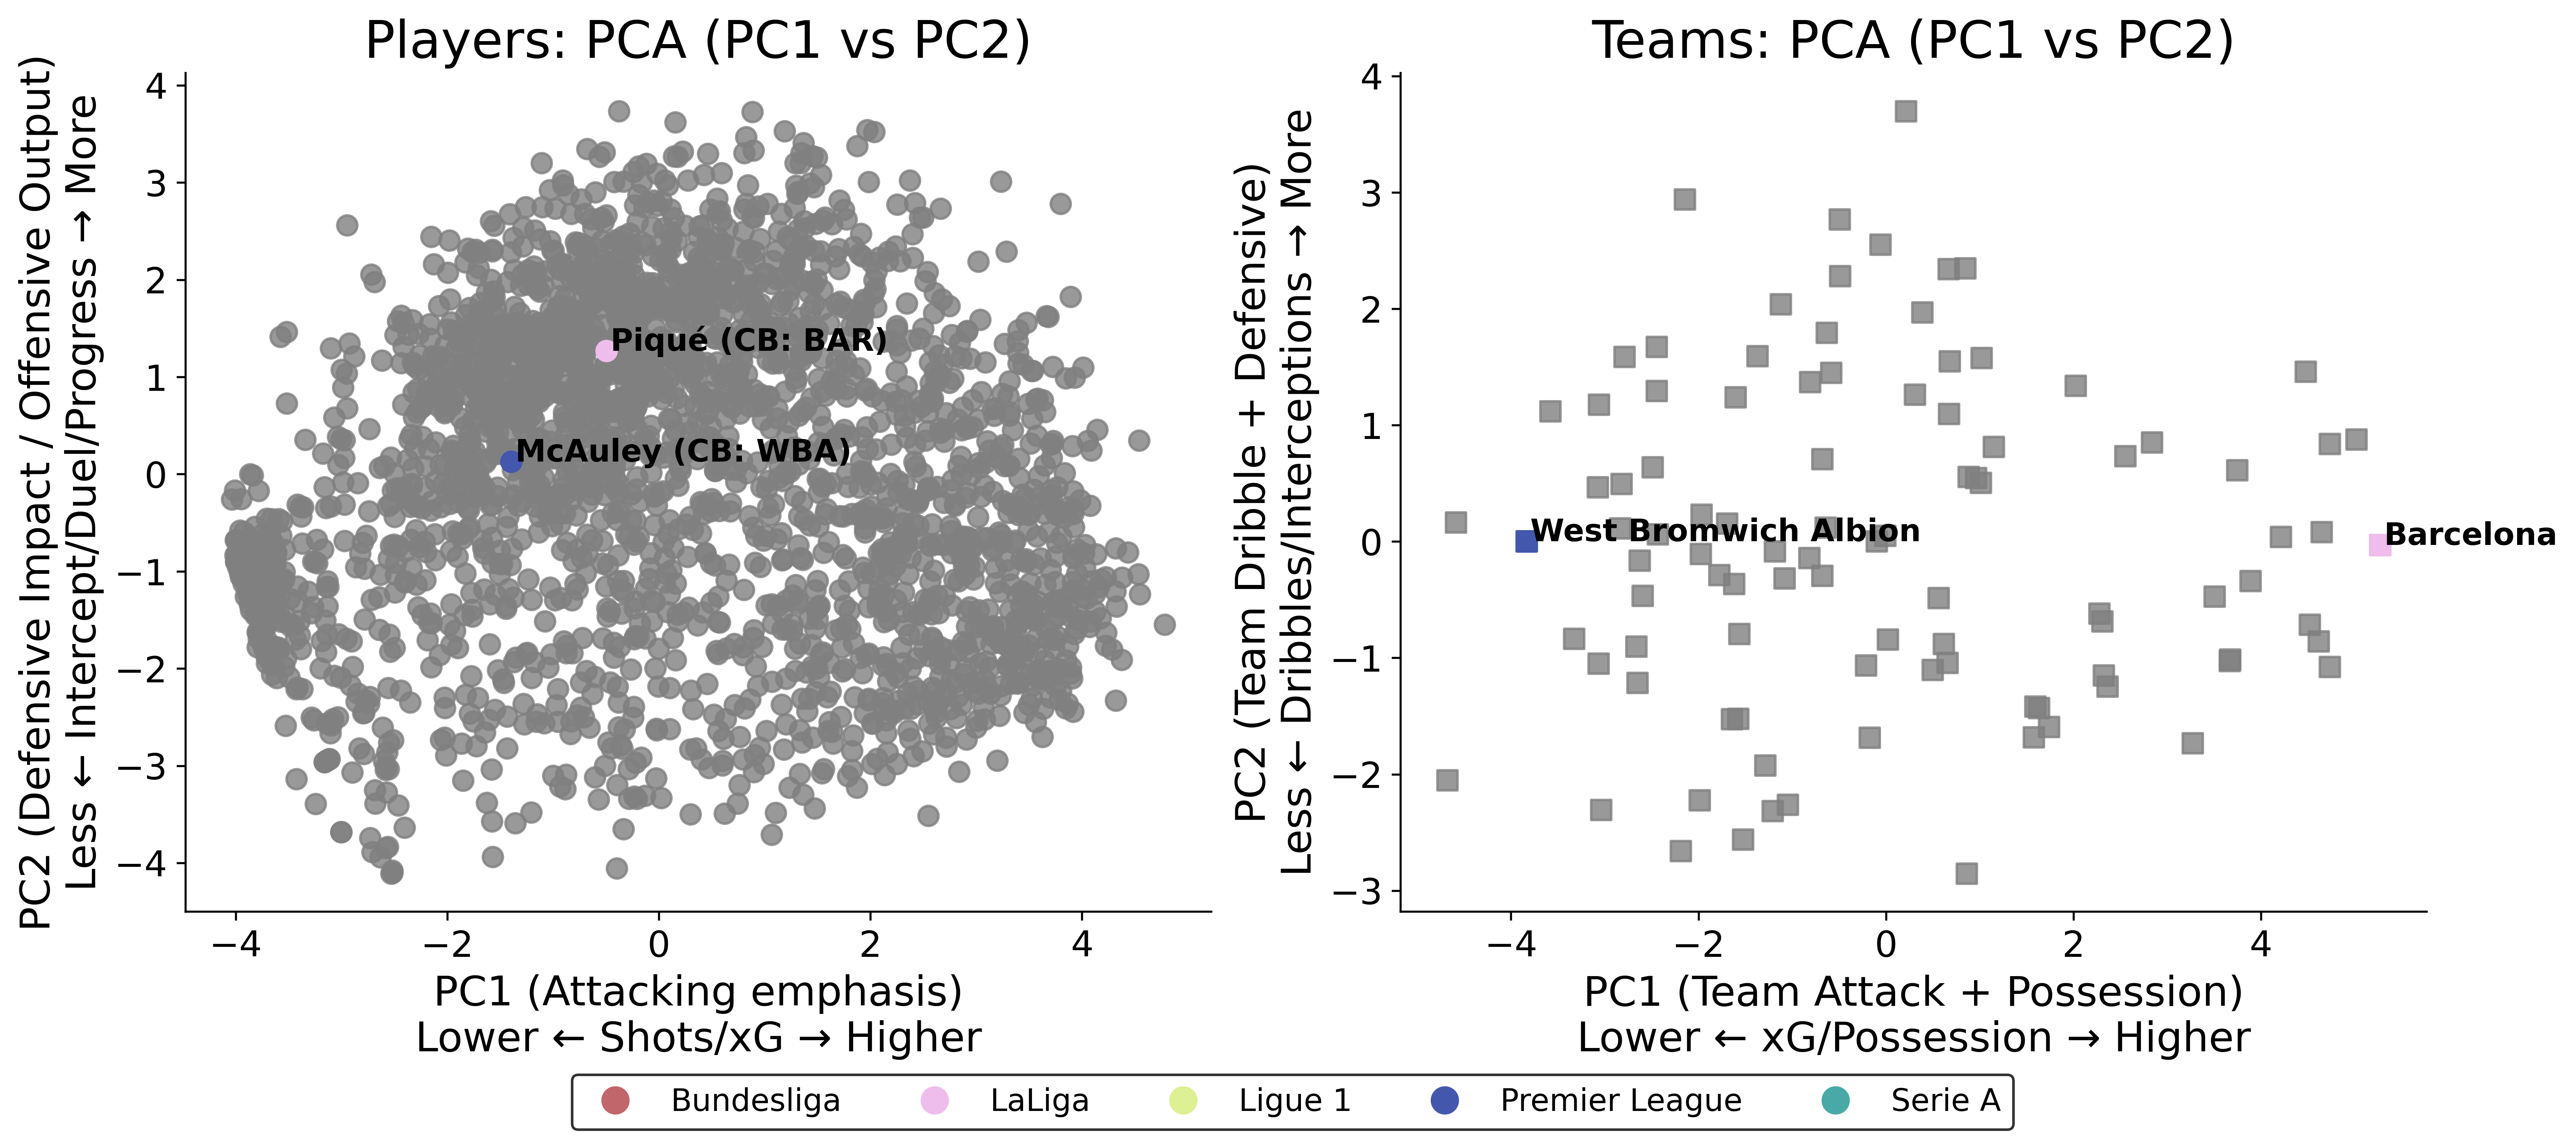
1) Gareth McAuley (West Bromwich Albion)
- Player PCA Coordinates: (PC1 ≈ –1.397, PC2 ≈ 0.132)
- McAuley sits on the negative side of the Attacking axis (PC1), indicating a lower xG/shot contribution.
- A moderate positive PC2 suggests considerable defensive impact (e.g., interceptions, duel success) plus some forward‐passing involvement.
- Team PCA Coordinates for West Brom: (PC1 ≈ –3.836, PC2 ≈ 0.004)
- West Brom ranks significantly left on the Team Attack + Possession axis (PC1), reflecting a more direct, less possession‐focused approach.
- Near‐zero on Team PC2 implies neither especially high nor especially low dribble/defensive emphasis.
Together, McAuley’s defensive, somewhat direct style correlates with West Brom’s overall strategy—less sustained possession, more direct transitions, and moderate defensive involvement.
2) Gerard Piqué (Barcelona)
- Player PCA Coordinates: (PC1 ≈ –0.498, PC2 ≈ 1.270)
- A slightly negative Attacking axis value (PC1) means Piqué contributes less xG/shot volume.
- A highly positive PC2 denotes strong defensive impact (duel success, interceptions) plus active forward‐passing tendencies.
- Team PCA Coordinates for Barcelona: (PC1 ≈ 5.272, PC2 ≈ –0.028)
- A strongly positive PC1 signals high xG/possession, characteristic of Barcelona’s renowned attacking style.
- Near‐zero on team PC2 places them around mid‐range in dribbles/defensive metrics, though their possession‐heavy buildup remains the defining trait.
Hence, Piqué’s own comfort on the ball—combining defensive solidity with progressive passing—aligns well with Barcelona’s broader philosophy of controlling matches through sustained attacking possession and measured defensive actions.
Comparing West Brom & McAuley vs. Barcelona & Piqué
- Attacking & Possession (PC1):
- West Brom is far to the left (PC1 ≈ –3.836), indicating a lower‐possession, more direct attacking style.
- Barcelona, by contrast, sits strongly to the right (PC1 ≈ 5.272), emphasizing high xG, structured buildup, and extended spells of possession.
- At the player level, McAuley (PC1 ≈ –1.397) contributes less to goal threat, whereas Piqué (PC1 ≈ –0.498) also offers limited shot/xG output but in a system that still fosters patient ball circulation.
- Defensive/Progressive (PC2):
- McAuley’s modestly positive PC2 (≈ 0.132) reflects a decent defensive presence plus some forward‐passing involvement—fitting a side that relies on direct, safety‐first transitions.
- Piqué’s significantly higher PC2 (≈ 1.270) underscores both defensive engagement and ball‐advancing ability, mirroring Barcelona’s expectation for center‐backs to intercept play and circulate the ball upfield.
In essence, the team placements show two tactical extremes—one favoring quick, direct transitions (West Brom), and the other championing possession‐dominant, methodical buildup (Barcelona). Meanwhile, at the player level, McAuley and Piqué each exhibit personal characteristics that align with their respective clubs, whether that’s robust aerial duels and straightforward passing or a more refined, ball‐playing center‐back role in a possession‐heavy environment.
Separate PCAs but Similar Stylistic Concepts and Validating this Approach
In the examples above, McAuley and West Brom appear to align around a direct defensive style, while Piqué and Barcelona seem suited to a possession-heavy, progressive approach. Next, we’ll examine some real-world transfers to explore this concept further. While not a guaranteed predictor, the idea is that when players’ PCA coordinates (in the player space) closely match a team’s overall style (in the team space), there’s a higher likelihood of a successful transfer. Conversely, significant mismatches might lead to suboptimal outcomes on the pitch. However, it’s crucial to acknowledge that this is a simplified model. In reality, many other factors influence transfer success, including a team’s potential tactical shifts, the manager’s philosophy, player adaptability, injuries, and even off-field factors. PCA, particularly when based on past data, cannot account for these dynamic elements. A team might be undergoing a transition in playing style, or a player might be acquired to add a different dimension to the squad, not necessarily to fit the existing mold. Therefore, while this analysis provides a useful framework for understanding player-team fit, it should be considered as one piece of a much larger puzzle.
Introducing the 2015/2016 Transfers
To put this approach into practice, I analyzed several notable transfers from the 2015/2016 season, evaluating how well players’ styles matched their new teams. These include:
- Defenders:
- Šime Vrsaljko (from Sassuolo to Atlético Madrid)
- Shkodran Mustafi (from Valencia to Arsenal)
- Raphaël Guerreiro (from Lorient to Dortmund)
- Attackers:
- Memphis Depay (from Manchester United to Lyon)
- Sadio Mané (from Southampton to Liverpool)
- Ousmane Dembélé (from Rennes to Dortmund)
- Midfielders:
- Miralem Pjanić (from AS Roma to Juventus)
- Paul Pogba (from Juventus to Manchester United)
- İlkay Gündoğan (from Dortmund to Manchester City)
Šime Vrsaljko – LaLiga & Atlético Madrid

Šime Vrsaljko’s transfer from Sassuolo to Atlético Madrid had plenty of intrigue, given Atlético’s defensively disciplined and possession-oriented style under Diego Simeone. A PCA-based look at Vrsaljko’s four key stylistic coordinates offers insight into how closely he matched with his new team.
Distance-Based PCA Ranking
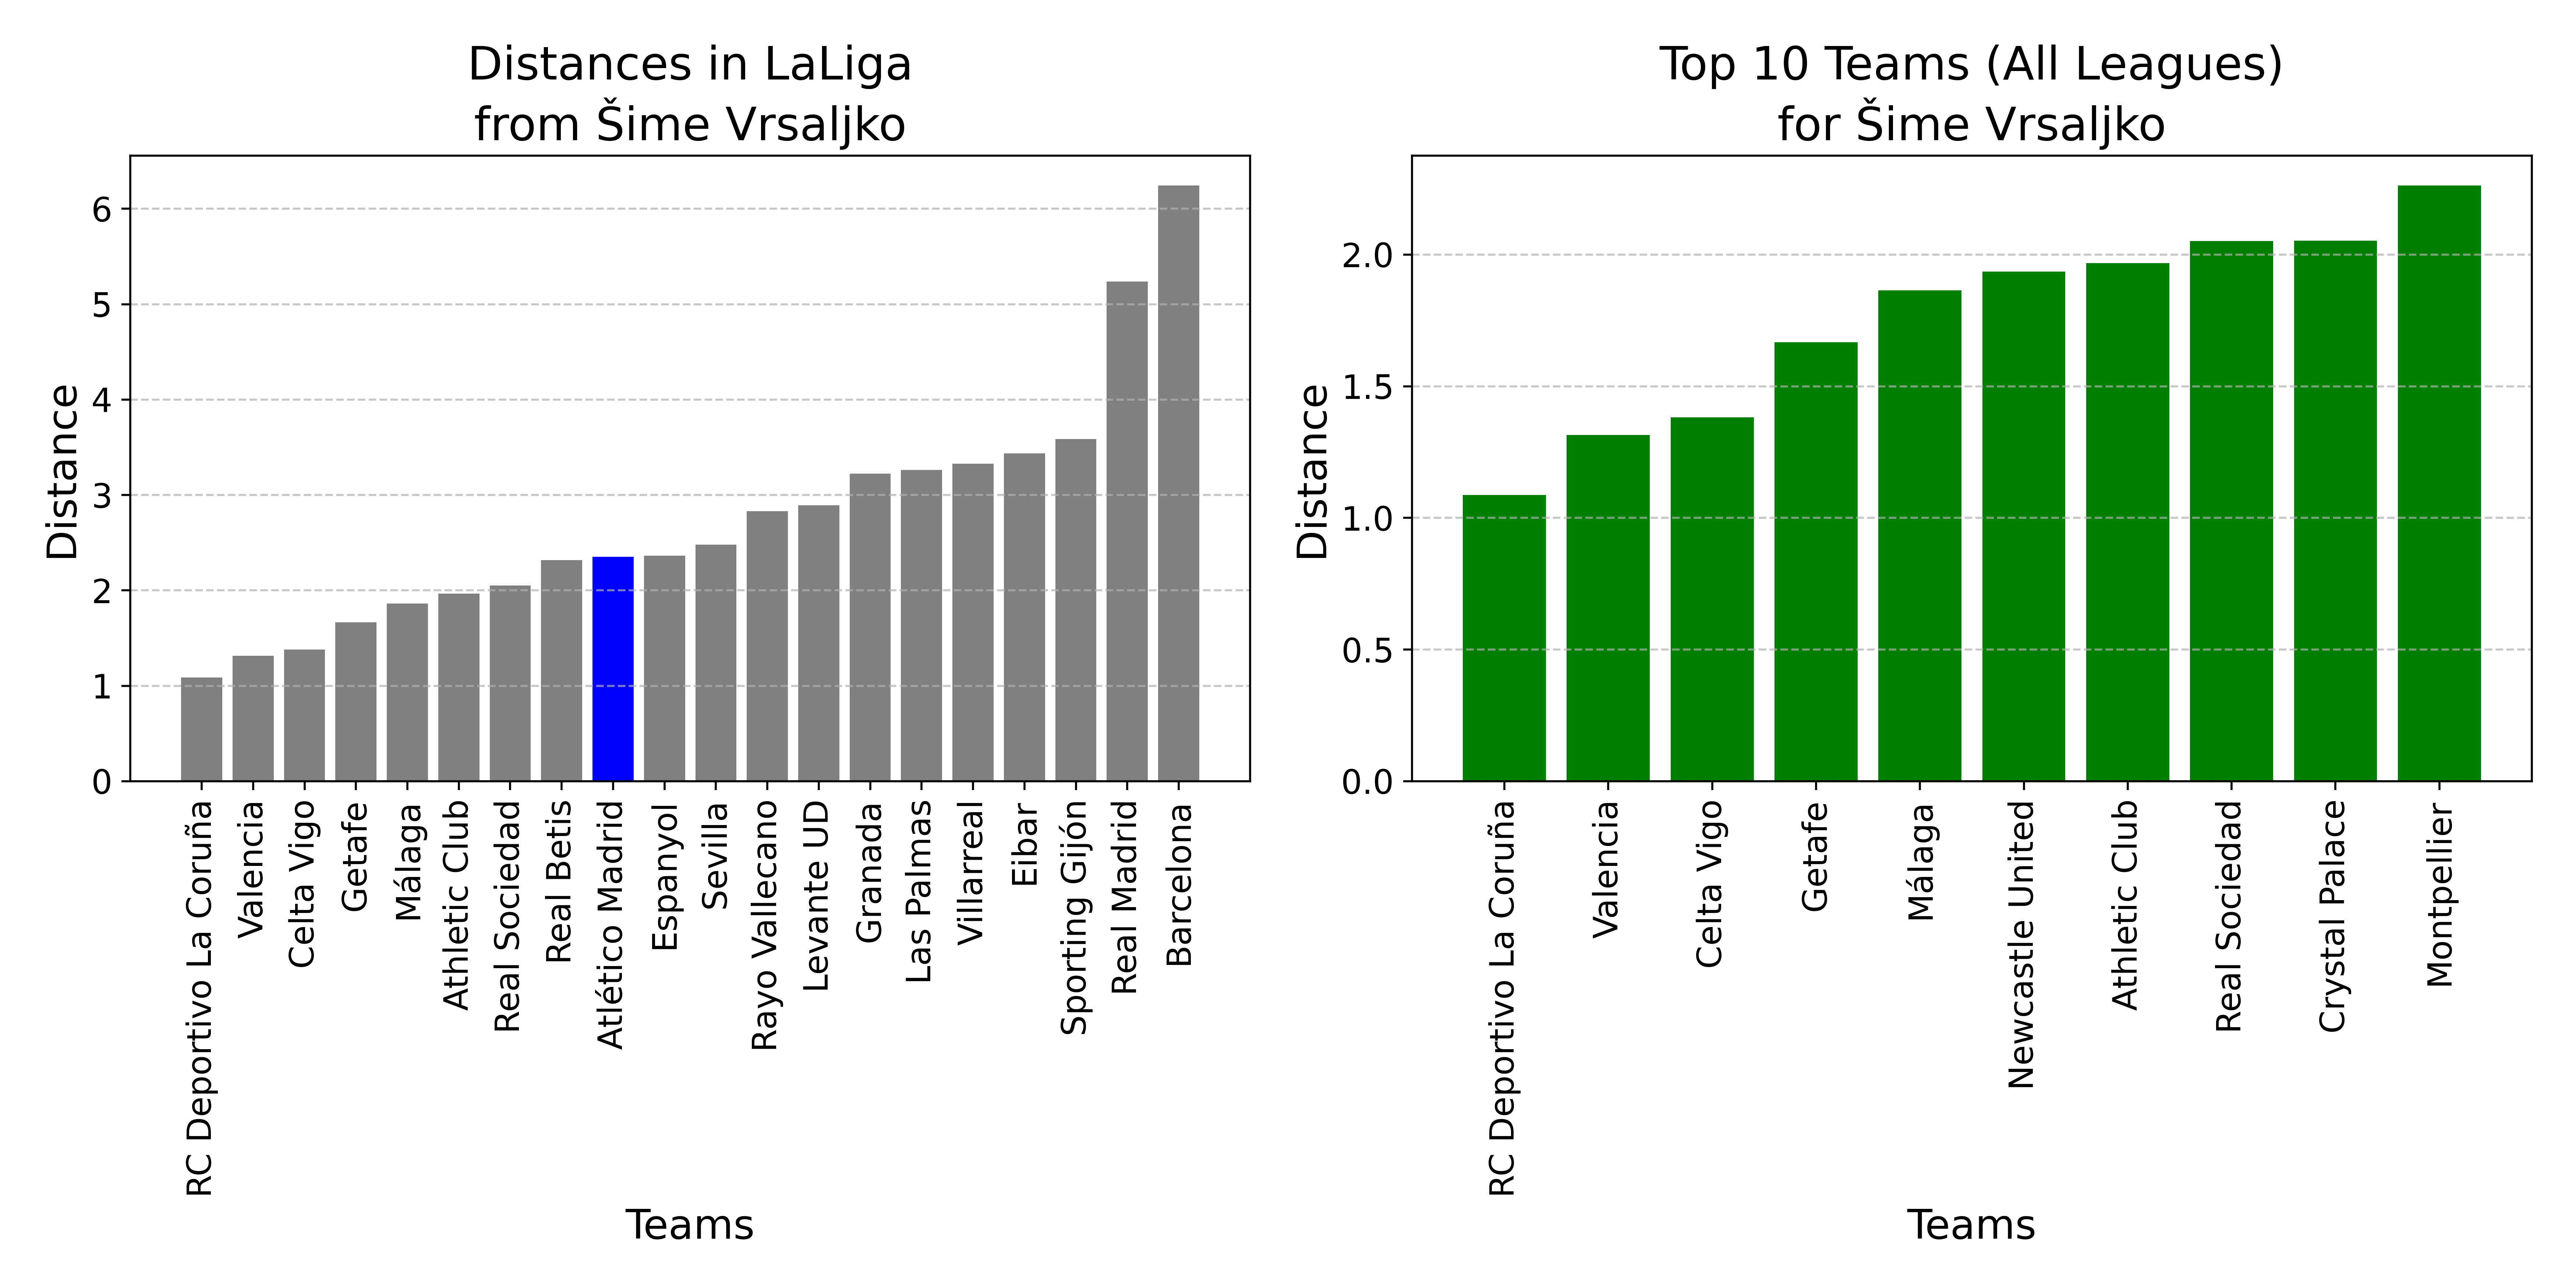
In LaLiga, Atlético Madrid ranks 9th out of 20 teams for similarity to Vrsaljko’s profile (distance: 2.3525). Clubs like RC Deportivo La Coruña (1st) and Valencia (2nd) score even closer to him in these metrics.
When considering all teams across Europe’s top five leagues, Atlético places 12th for Vrsaljko—still reasonably high, but below certain other clubs with slightly tighter stylistic matches.
Below is a direct comparison using the four shared themes (PCs) that form the basis of the distance metric:
- Attacking (PC1)
- Vrsaljko: -0.160
- Atlético: 2.020
- Meaning: Atlético registers a stronger attacking orientation (shots, xG) than Vrsaljko’s more modest offensive contribution. This gap can indicate that while Vrsaljko fits their system, he isn’t a primary attacking outlet.
- Possession (PC3)
- Vrsaljko: 1.666
- Atlético: 1.590
- Meaning: Both have high positive scores here, pointing to comfort in a more controlled, possession-friendly setup. Their close values suggest good alignment in ball retention preferences.
- Defensive (PC2)
- Vrsaljko: 1.634
- Atlético: 1.342
- Meaning: Vrsaljko’s style leans heavily on defensive interventions and physical duels, which also aligns well with Atlético’s strong defensive ethos. They’re quite close on this dimension, reinforcing a natural fit in Simeone’s system.
- Directness
- Vrsaljko (PC5): -0.872
- Atlético (PC4): -0.042
- Meaning: Negative values reflect a preference away from pure, long-ball directness. Although Atlético’s score is closer to zero (slightly more direct than Vrsaljko), both lean away from a heavy reliance on long passes—another point of broad compatibility.
Overall Verdict
Although Atlético Madrid ranks 9th in LaLiga and 12th overall for similarity to Vrsaljko, their high alignment on possession and defensive play indicates Simeone’s system did suit many of Vrsaljko’s strengths. The largest mismatch lies in attacking output, where Atlético projects a higher offensive tilt than Vrsaljko himself. Despite these nuances, once he settled in, Vrsaljko’s ball-carrying and defensive skillset proved a strong tactical fit.
His subsequent career path may have taken him elsewhere, but this data-driven snapshot illustrates why he could integrate well when healthy—his defensive and possession traits meshed strongly with Atlético’s established identity, even if he was less of a direct attacking force than some of his teammates.
Shkodran Mustafi – Premier League & Arsenal

Shkodran Mustafi’s 2016 transfer from Valencia to Arsenal provided an intriguing case for PCA-based stylistic analysis. The metrics below show that while Mustafi’s defensive strengths were valuable, there were significant mismatches between his overall style and Arsenal’s tactical identity under Arsène Wenger.
Distance-Based PCA Ranking
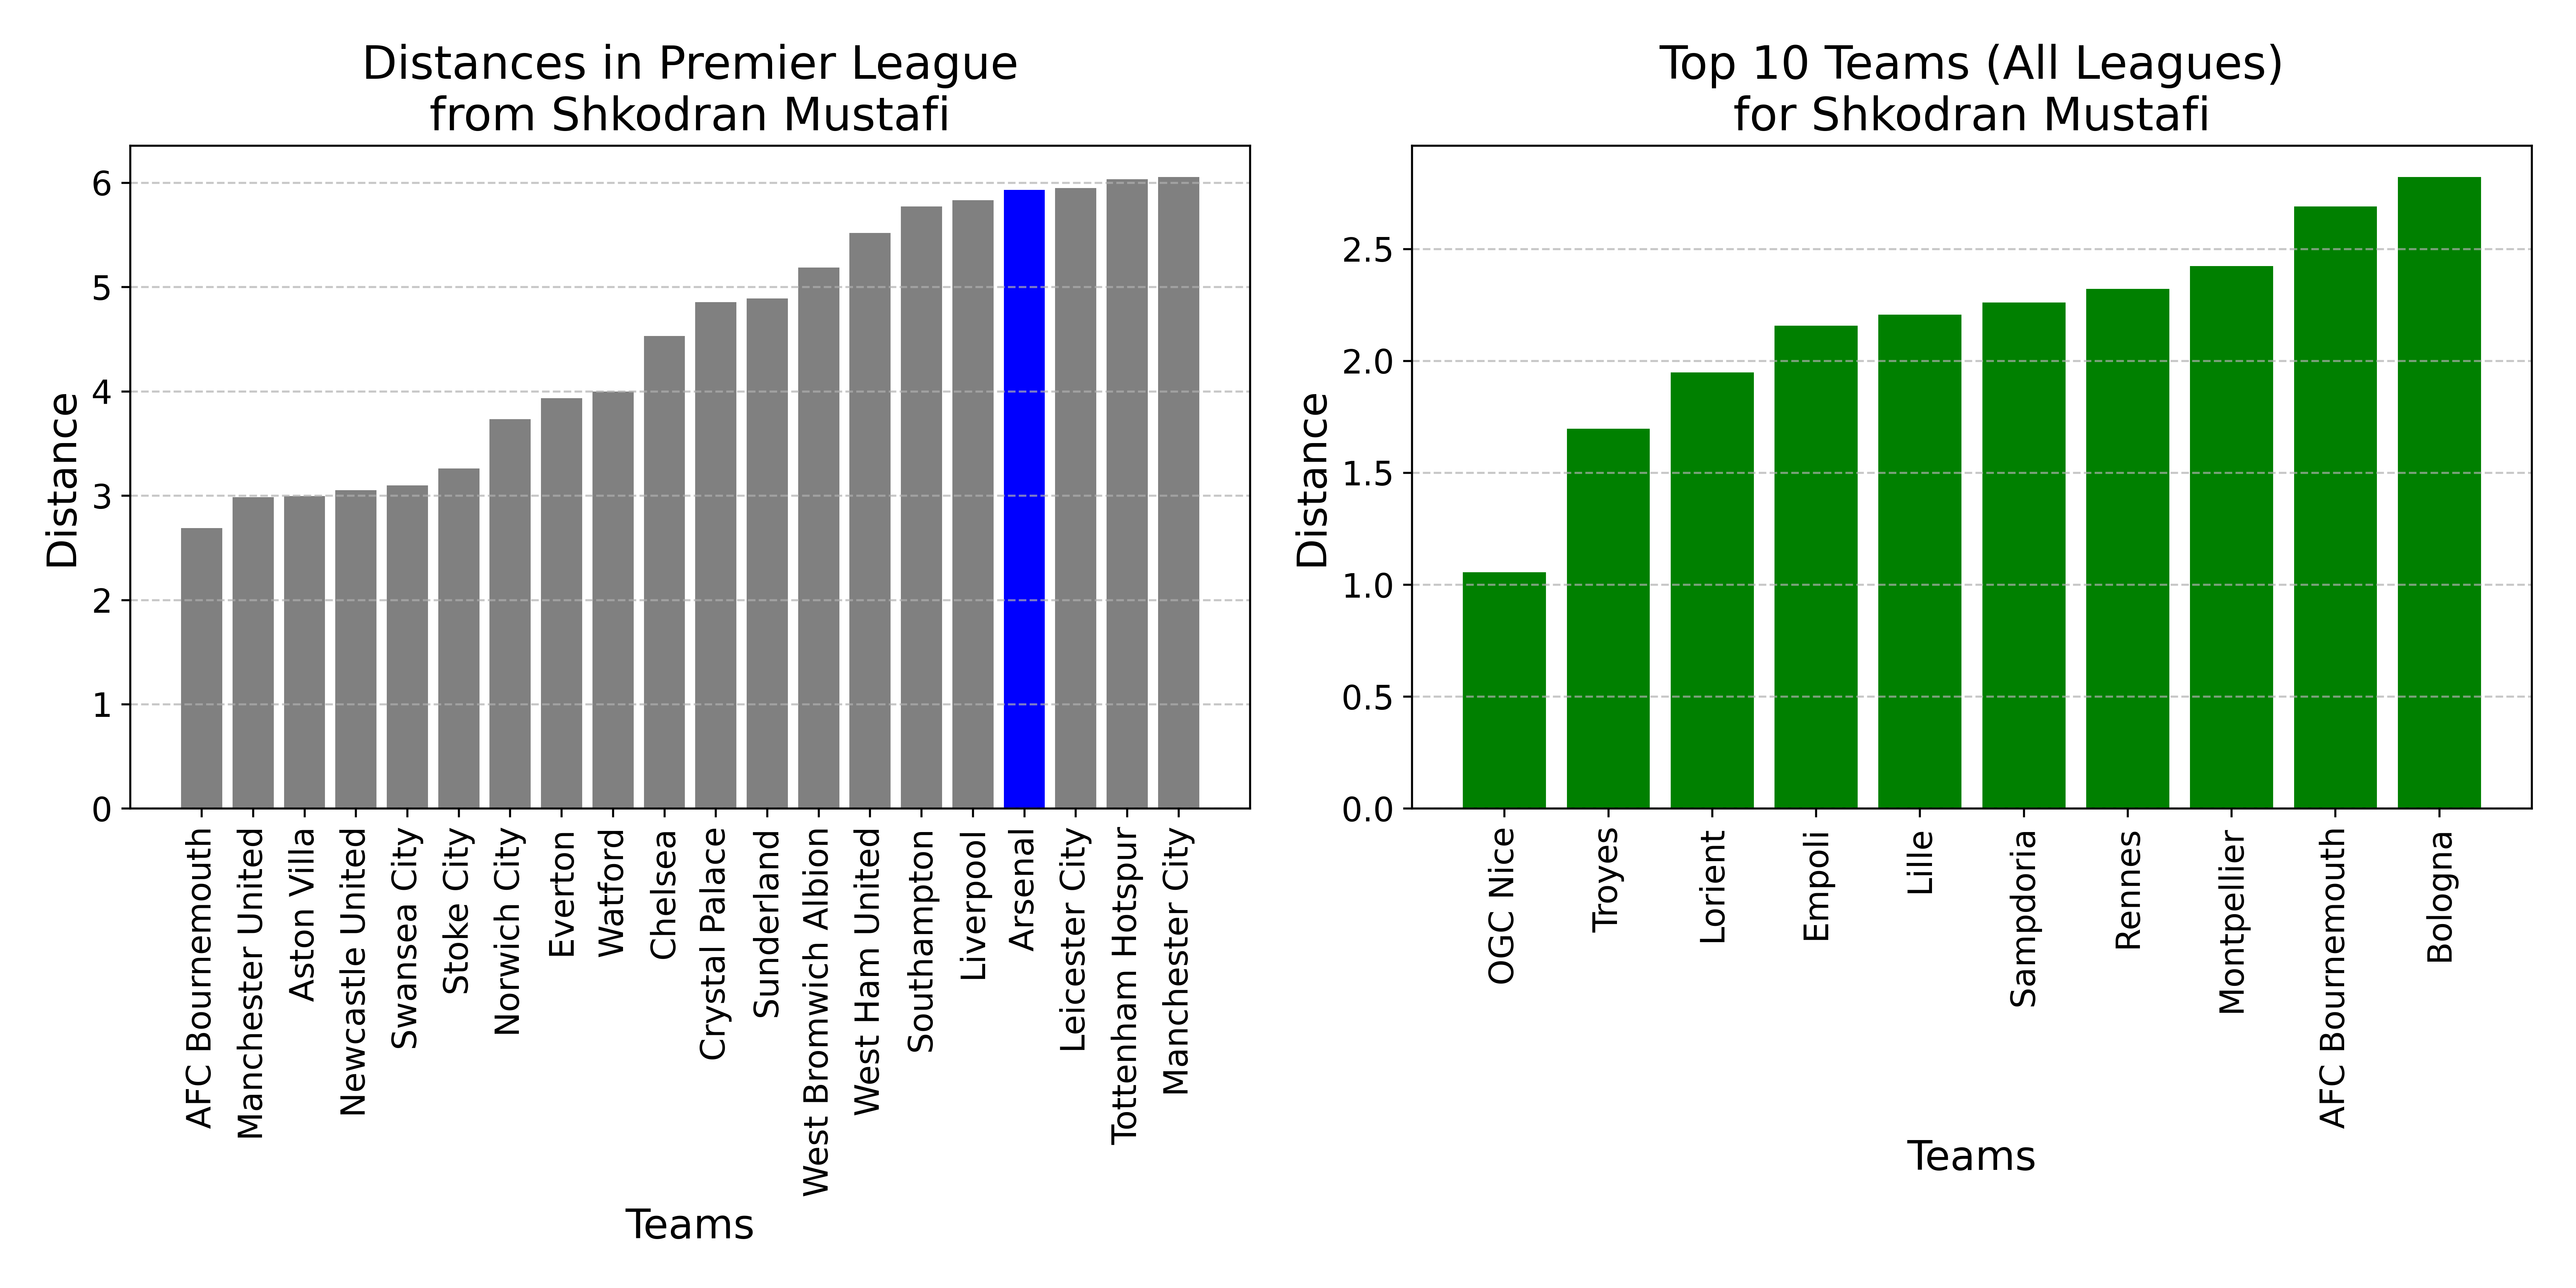
In the Premier League, Arsenal ranks 17th out of 20 in similarity to Mustafi’s profile (distance: 5.93). Other clubs, such as AFC Bournemouth (1st) and Manchester United (2nd), are notably closer matches. Across the top five leagues, Arsenal sits at #84 in proximity to Mustafi, underscoring a significant stylistic gap.
Four Theme Comparison
- Attacking (PC1)
- Mustafi: -0.16
- Arsenal: 4.47
- Meaning: Arsenal’s high attacking score reflects their focus on chance creation and offensive output. Mustafi’s negative value indicates he contributes less in forward actions, resulting in a considerable mismatch here.
- Possession (PC3)
- Mustafi: -1.28
- Arsenal: -0.01
- Meaning: Arsenal hovers near neutral on possession reliance, but Mustafi’s more negative value suggests he’s less oriented toward patient, ball-dominant play. While the gap is smaller than in “Attacking,” it still signals some misalignment.
- Defensive (PC2)
- Mustafi: 2.39
- Arsenal: 1.46
- Meaning: Both emphasize defending above average, but Mustafi’s notably high defensive score indicates a style tailored to blocking, tackling, and reading the game—fitting well within a structured backline but not necessarily a high-possession approach.
- Directness
- Mustafi (PC5): 2.11
- Arsenal (PC4): -1.24
- Meaning: Mustafi shows a strong preference for direct play and longer passes, while Arsenal’s negative value reflects a more measured buildup. This stark difference suggests a fundamental clash in how the ball is moved from the back.
Mustafi’s Time at Arsenal
While Mustafi’s defensive prowess should have added solidity, the PCA scores confirm major stylistic mismatches—particularly in attacking involvement and directness—that challenged his integration into a more possession-based, free-flowing Arsenal. Although he occasionally excelled in breaking up opposition play, his tendency toward direct transitions was less suited to a team that favored controlled buildup. This gap in approach helps explain the inconsistencies and errors that often marked his Arsenal tenure. Ultimately, despite Mustafi’s individual defensive qualities, his overall style clashed with Arsenal’s tactical blueprint, limiting his long-term effectiveness under Wenger’s system.
Raphaël Guerreiro – Bundesliga & Borussia Dortmund

Raphaël Guerreiro’s 2016 transfer from FC Lorient to Borussia Dortmund sparked significant interest. A PCA-based look at his four core stylistic themes shows that although Dortmund was not the absolute closest Bundesliga match on paper, key parts of Guerreiro’s skill set did align with BVB’s approach under managers like Thomas Tuchel and subsequent coaches.
Distance-Based Ranking

In the Bundesliga:
- Bayer Leverkusen ranks as the closest stylistic match (distance: 3.65).
- Borussia Dortmund is 5th (4.63), placing them mid-table for Guerreiro’s style alignment.
Across Europe’s top five leagues, Dortmund ranks 64th overall. Notably, clubs like Celta Vigo and Atlético Madrid post smaller distances, suggesting they might share more attributes with Guerreiro’s profile.
Four Theme Comparison
- Attacking (PC1)
- Guerreiro: 1.71
- Dortmund: 4.61
- Meaning: Dortmund’s very high attacking score highlights their focus on creating chances and pressing forward. Guerreiro’s more moderate number indicates he contributes in attack but isn’t as offensively skewed as BVB’s overall style.
- Possession (PC3)
- Guerreiro: 1.26
- Dortmund: -0.80
- Meaning: Guerreiro’s positive score suggests a comfort with controlled, ball-oriented play. Dortmund’s negative value implies more willingness to transition quickly rather than rely on slow buildup. This mismatch is notable but not necessarily prohibitive.
- Defensive (PC2)
- Guerreiro: 1.78
- Dortmund: -0.86
- Meaning: Guerreiro’s higher defensive emphasis (duels, interceptions) contrasts with Dortmund’s lower score here. While Dortmund’s pressing system is still intense, the PCA indicates their overall profile is less about pure defending than an individual like Guerreiro might prefer.
- Directness
- Guerreiro (PC5): -0.91
- Dortmund (PC4): 0.45
- Meaning: Guerreiro’s negative score means he’s less inclined toward purely direct, long-ball strategies; Dortmund’s slight positive suggests they’re somewhat more direct in moving the ball forward. There’s some stylistic clash, but not extreme.
Guerreiro’s Time at Borussia Dortmund
Despite the PCA revealing certain gaps—particularly in attacking and defensive orientations—Guerreiro’s strong possession play and versatility allowed him to thrive at Dortmund. Under coaches like Tuchel, he often excelled in advanced or hybrid roles, contributing to the attack while still lending defensive support. Over time, his adaptability bridged some of the stylistic mismatches indicated by the data, illustrating how an individual player’s technique and tactical understanding can flourish even if the initial PCA distance is moderate.
Memphis Depay – Ligue 1 & Lyon

Memphis Depay’s move from Manchester United to Lyon in January 2017 marked a pivotal moment in his career. A look at PCA-based style metrics shows how Depay’s attacking flair and dribbling skills found a natural home in Lyon’s forward-oriented setup, even if there were smaller gaps in other dimensions.
Distance-Based Ranking
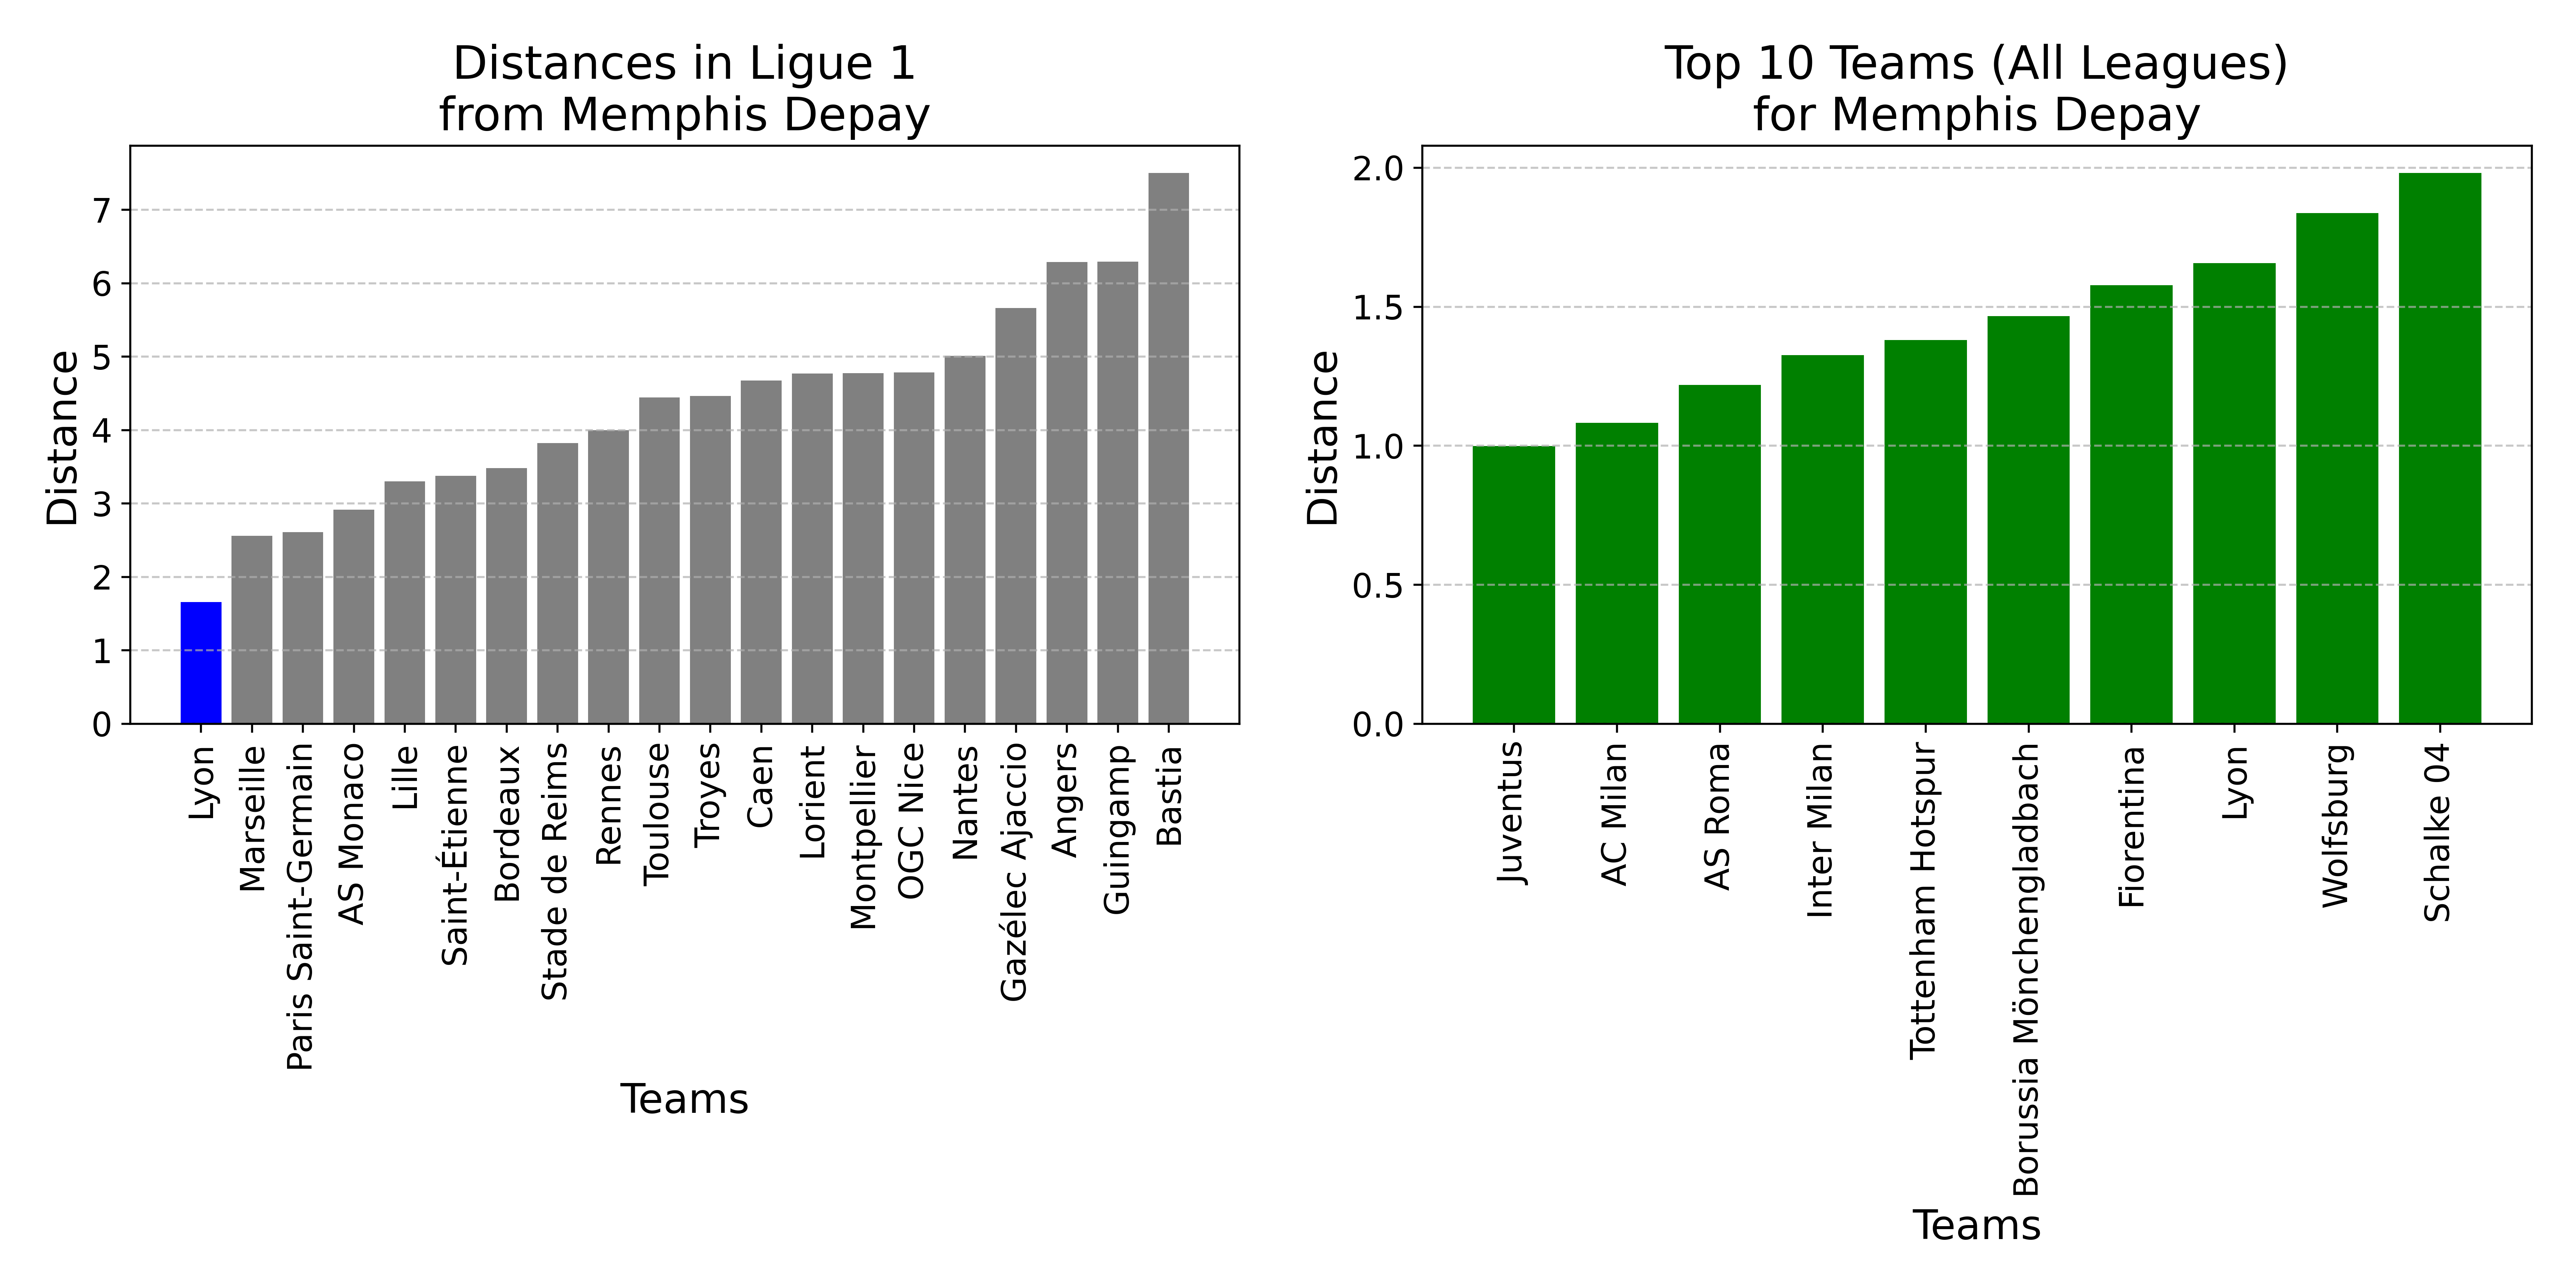
- Within Ligue 1:
- Lyon emerges as the closest match to Depay (distance: 1.657).
- Next best are Marseille (2.559) and PSG (2.610).
- Across the top five leagues:
- Lyon ranks 8th overall, behind clubs like Juventus, AC Milan, and AS Roma.
Four Theme Comparison
- Attacking (PC1)
- Depay: 2.70
- Lyon: 3.89
- Meaning: Both lean strongly toward goal-oriented play (shots, xG). Lyon is even more aggressively offensive, aligning well with Depay’s preference for taking on defenders and creating scoring opportunities.
- Possession (PC3)
- Depay: -0.38
- Lyon: -1.02
- Meaning: Both are on the “lower possession” side of the spectrum, preferring quicker transitions over slow buildup. The gap isn’t huge, suggesting Depay’s skill set fits Lyon’s directness in possession phases fairly well.
- Defensive (PC2)
- Depay: -1.25
- Lyon: -0.34
- Meaning: Depay is less defensively inclined, while Lyon is only slightly below average. There’s some mismatch here—Lyon’s style demands moderate defensive involvement, whereas Depay’s profile emphasizes more offensive contributions.
- Directness
- Depay (PC5): -0.42
- Lyon (PC4): -0.12
- Meaning: Both scores are negative, indicating neither heavily relies on long-ball tactics. Depay’s somewhat lower value suggests he’s more comfortable taking on players or combining short passes, which still meshes with Lyon’s relatively balanced approach.
Depay’s Rejuvenation at Lyon
By joining Lyon — the best match for his style within Ligue 1—Depay found a system that leveraged his dribbling, chance creation, and goal-scoring instincts. Though he wasn’t a perfect fit in defensive duties, his strong attacking output overshadowed this shortcoming. The PCA underscores why Depay thrived in Lyon’s offense: both parties favor direct attacking play without overly depending on lengthy possession spells. This alignment ultimately allowed Depay to rediscover his form, becoming a key figure in Lyon’s frontline and revitalizing his career trajectory.
Sadio Mané – Premier League & Liverpool

Sadio Mané’s 2016 move from Southampton to Liverpool marked the start of a remarkable journey under Jürgen Klopp. A closer look at PCA-based style metrics shows just how closely Mané’s dynamic attacking profile meshed with Liverpool’s high-intensity system.
Distance-Based Ranking
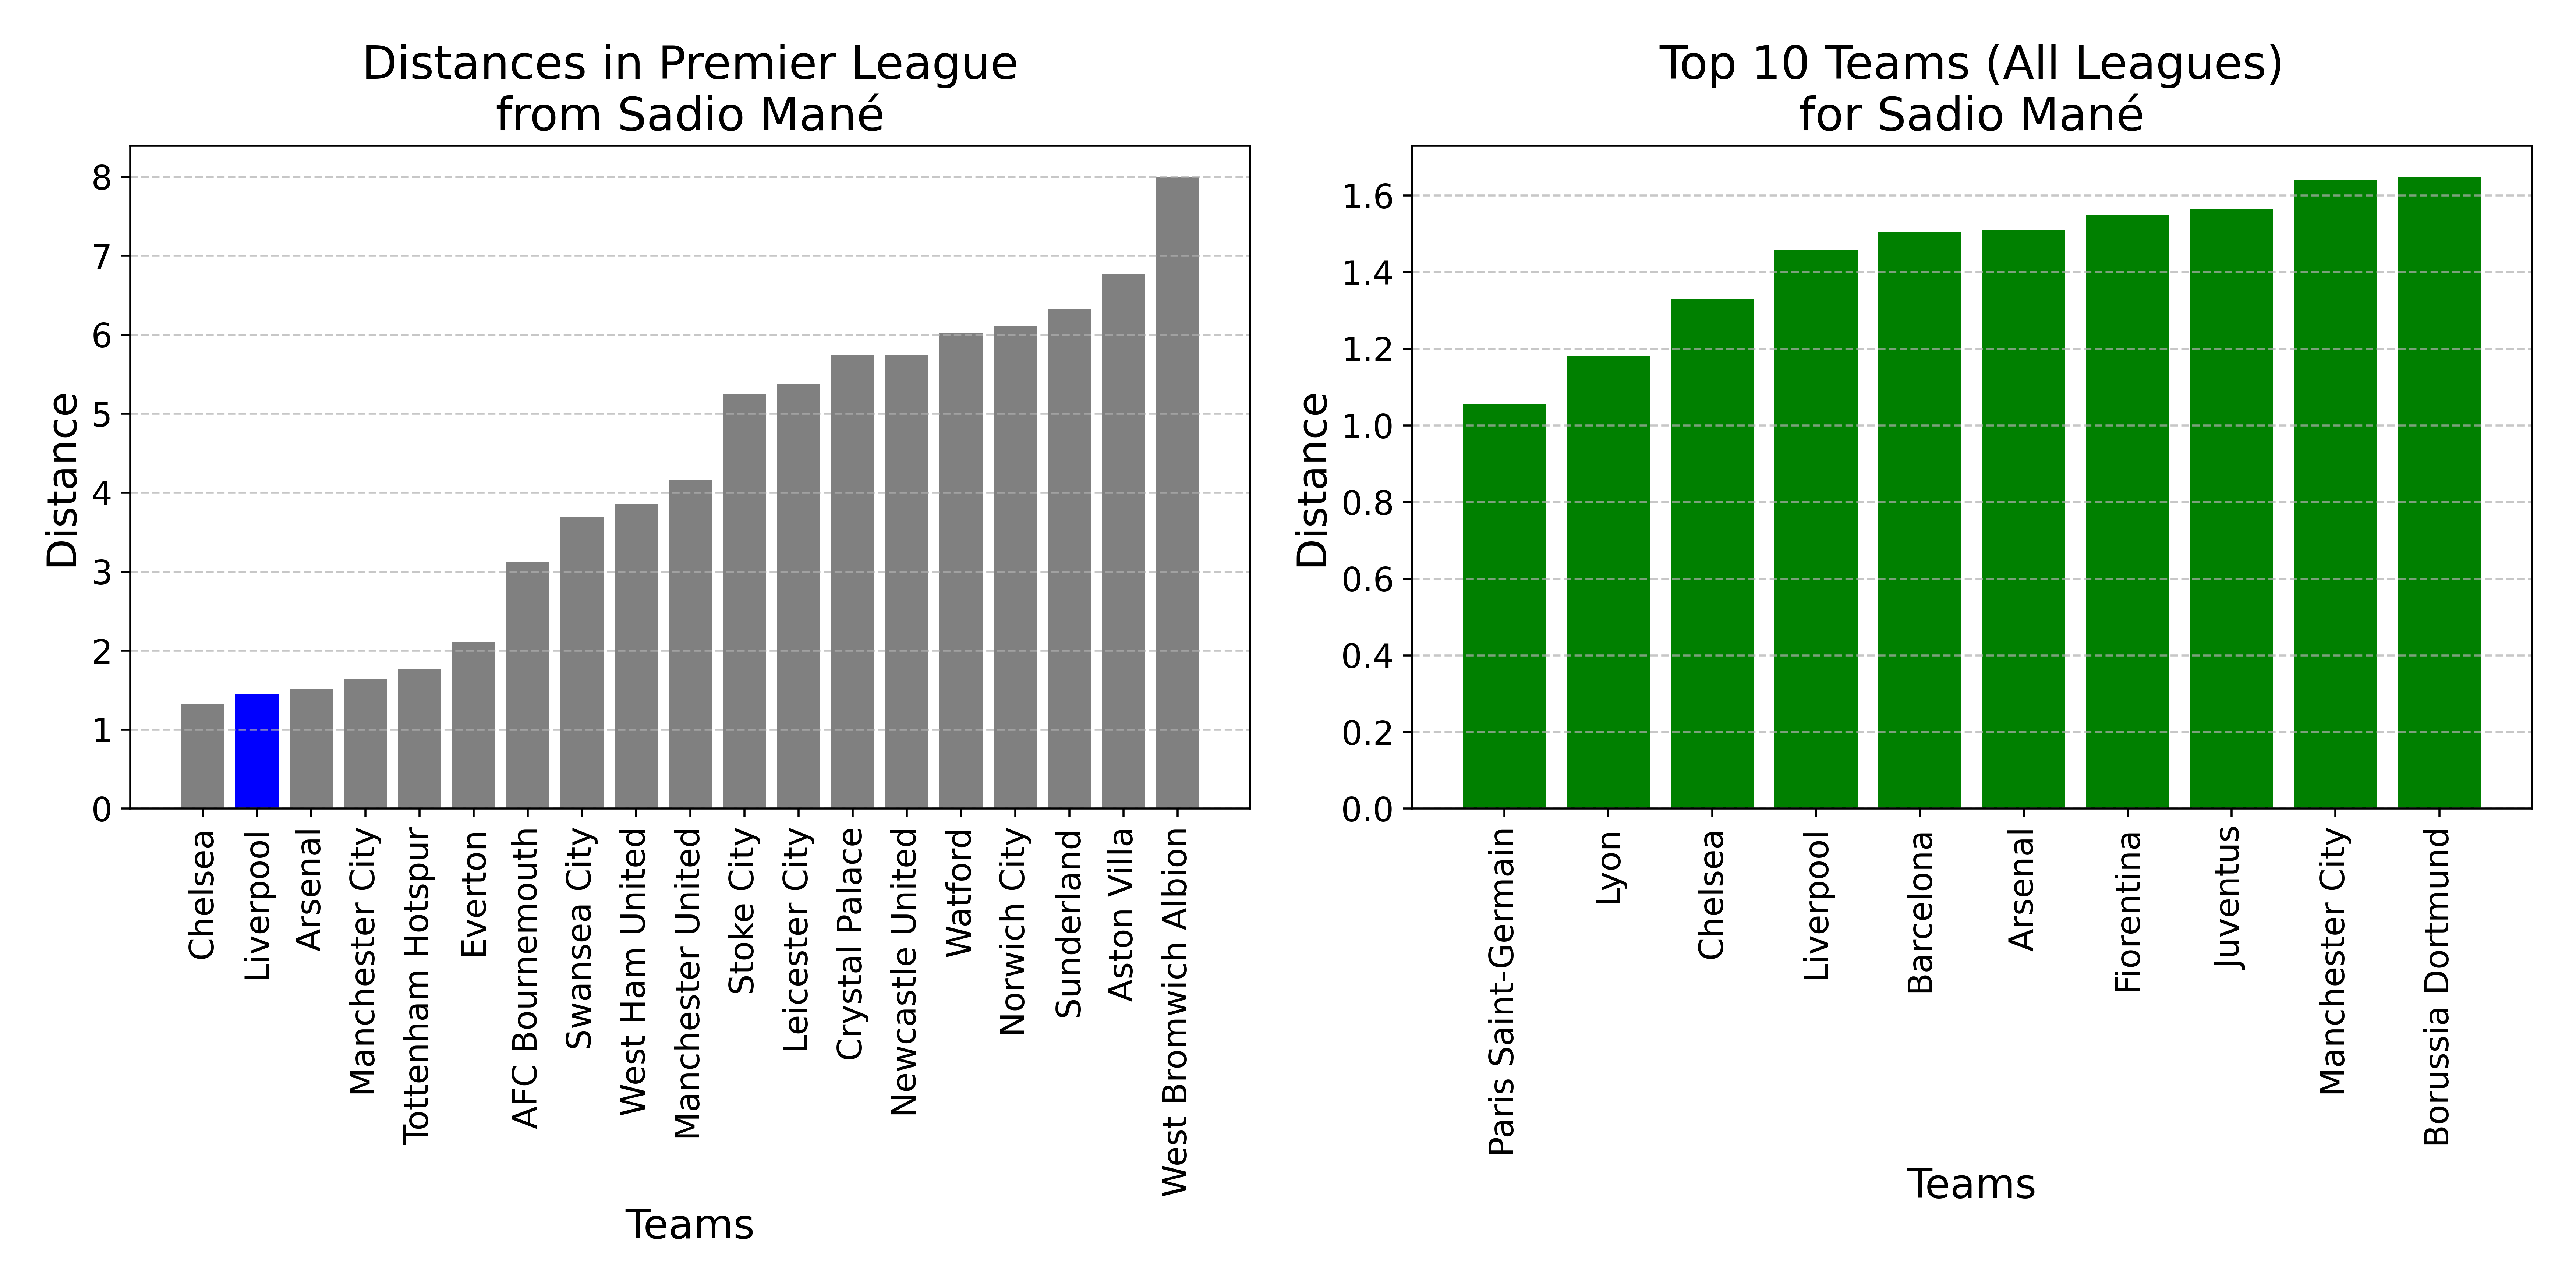
- Premier League:
- Chelsea is the closest match (distance: 1.33), then Liverpool at 1.46, followed by Arsenal (1.51) and Man City (1.64).
- This tight cluster demonstrates that several top PL teams share Mané’s fast-paced, attacking style.
- Across the top five leagues:
- Liverpool ranks 4th overall for Mané, emphasizing a strong stylistic compatibility.
Four Theme Comparison
- Attacking (PC1)
- Mané: 4.14
- Liverpool: 4.21
- Meaning: Both are extremely attack-heavy, focusing on shots, xG, and chance creation. Their near-identical scores reflect a natural fit in forward play.
- Possession (PC3)
- Mané: -0.19
- Liverpool: 1.14
- Meaning: Mané is close to neutral but slightly less inclined toward high-possession buildup; Liverpool has a positive bias here, reflecting a balance of pressing and controlled possession. The gap isn’t huge, but it highlights the team’s readiness to hold the ball more than Mané might solo.
- Defensive (PC2)
- Mané: 0.46
- Liverpool: 0.04
- Meaning: Both are positive but not extreme, indicating willingness to engage defensively without being entirely defense-first. Mané’s slightly higher figure suggests he’ll press and recover the ball actively—well-suited to Klopp’s high-press approach.
- Directness
- Mané (PC5): -0.18
- Liverpool (PC4): 0.23
- Meaning: Mané leans a bit away from pure long-ball transitions, whereas Liverpool is slightly more direct. This minor difference still fits well because the club mixes swift vertical attacks with possession-based phases.
Mané’s Time at Liverpool
By joining Liverpool—the 2nd‐closest match in the Premier League and 4th overall—Mané found a system that maximized his explosiveness, dribbling, and attacking instincts. Under Klopp, he thrived in a fluid frontline that capitalized on his pace and high-intensity pressing. The PCA underscores the synergy: both Mané and Liverpool prioritize dynamic attacking output and active defensive involvement, making for an almost seamless integration and a catalyst for Liverpool’s ascent in domestic and European competitions.
Ousmane Dembélé – Bundesliga & Borussia Dortmund

Ousmane Dembélé’s 2016 transfer from Rennes to Borussia Dortmund showcased his potential as a high-impact attacker. A look at PCA-based style metrics suggests a strong stylistic fit with Dortmund’s attacking principles, despite some minor differences in possession and directness.
Distance-Based Ranking
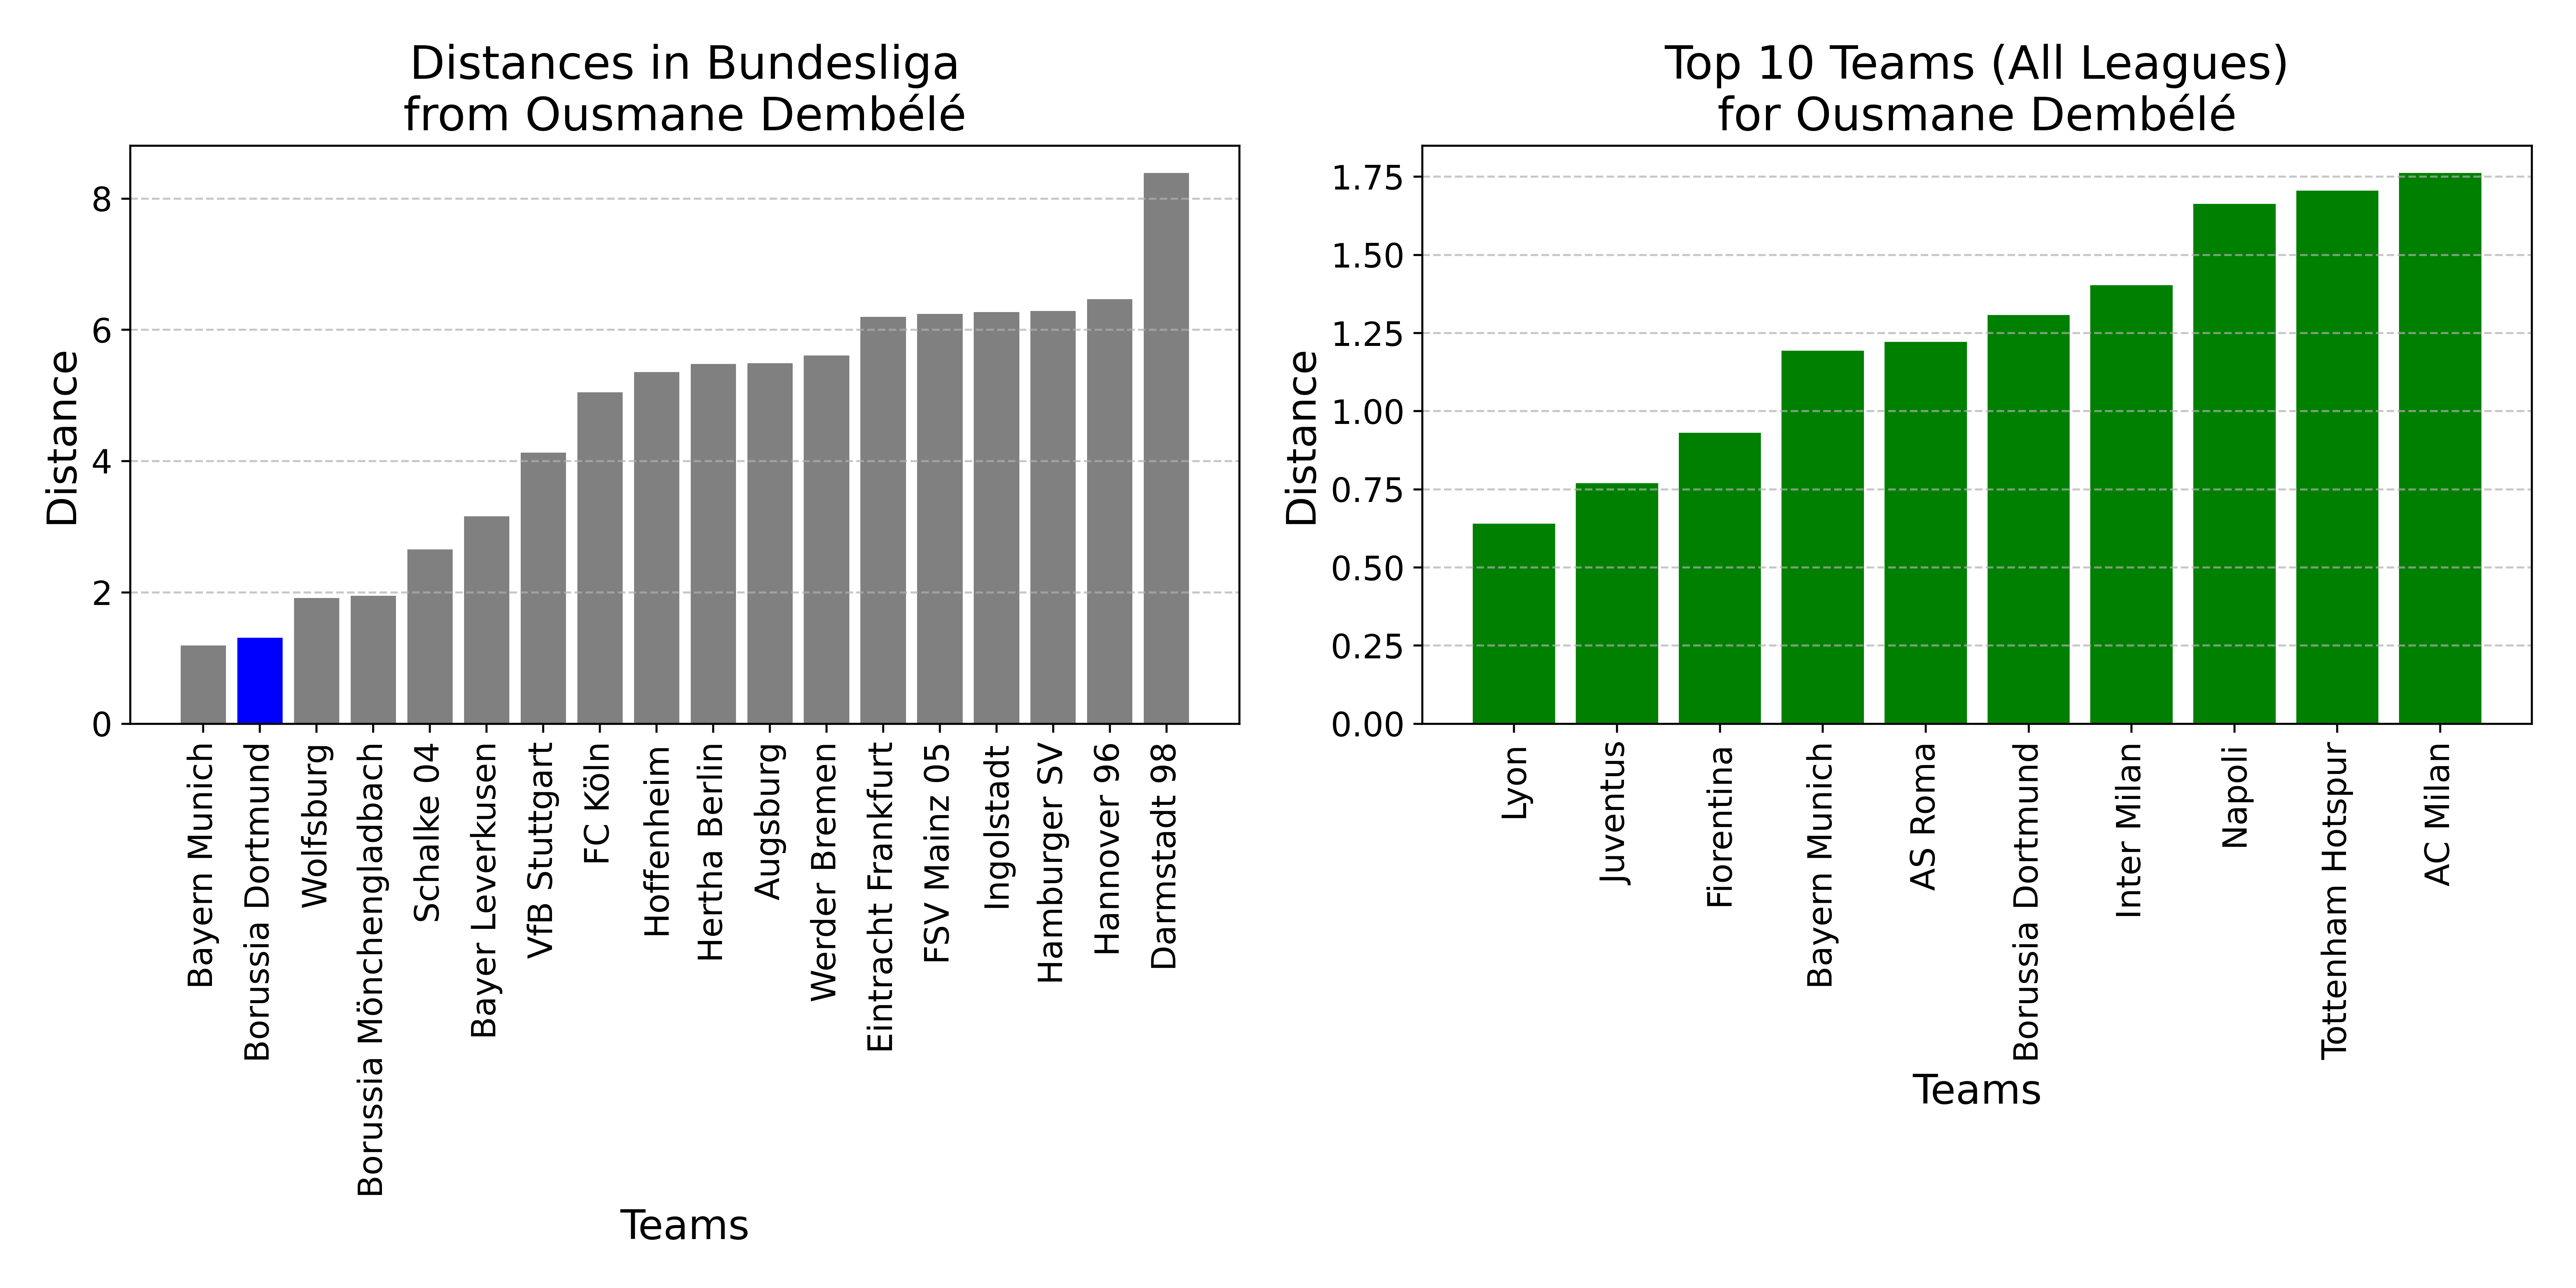
- Within the Bundesliga:
- Bayern Munich is the closest match (distance: 1.19), followed by Borussia Dortmund** at 1.31, then Wolfsburg at 1.91.
- Dortmund’s second-place finish here indicates a strong alignment with Dembélé’s profile.
- Across the top five leagues:
- Dortmund ranks 6th, behind clubs like Lyon, Juventus, and Bayern.
Four Theme Comparison
- Attacking (PC1)
- Dembélé: 3.61
- Dortmund: 4.61
- Meaning: Both emphasize attacking output (shots, xG, chance creation), with Dortmund slightly more extreme. This synergy favors Dembélé’s forward drive.
- Possession (PC3)
- Dembélé: -1.11
- Dortmund: -0.80
- Meaning: Neither leans heavily on slow, methodical buildup. While Dortmund is closer to neutral, Dembélé’s more negative score suggests an even quicker, freer approach, which still integrates well in a high-paced offense.
- Defensive (PC2)
- Dembélé: -0.87
- Dortmund: -0.86
- Meaning: Both land on the same side of the scale, indicating neither is strongly defensive-minded. For a front-footed team like Dortmund, this match is beneficial as Dembélé isn’t asked to do heavy defensive work.
- Directness
- Dembélé (PC5): -0.33
- Dortmund (PC4): 0.45
- Meaning: Dortmund is more open to direct passing, while Dembélé is mildly less so. This small gap implies Dortmund may play forward passes more aggressively, but Dembélé’s preference for dribbling and quick combinations still complements a fast, attacking style.
Dembélé’s Time at Borussia Dortmund
Dembélé’s immediate impact at Dortmund came from his explosive dribbling, quick interplay, and chance creation—traits well-suited to Thomas Tuchel’s attacking philosophy. While not fully identical in every dimension (notably in directness and possession style), the PCA indicates that both player and club prioritize attacking prowess and minimal defensive responsibilities for offensive stars. The result was a highly productive (if brief) Dortmund spell, illustrating how even moderate stylistic differences can be overcome by a talented individual in a compatible, forward-thinking system.
Miralem Pjanić – Serie A & Juventus

Miralem Pjanić’s 2016 move from AS Roma to Juventus placed him in one of Europe’s most competitive environments. Analyzing PCA-based style dimensions reveals how his creative playmaking meshed with Juve’s tactical blueprint, even though the club wasn’t his absolute top stylistic match.
Distance-Based Ranking
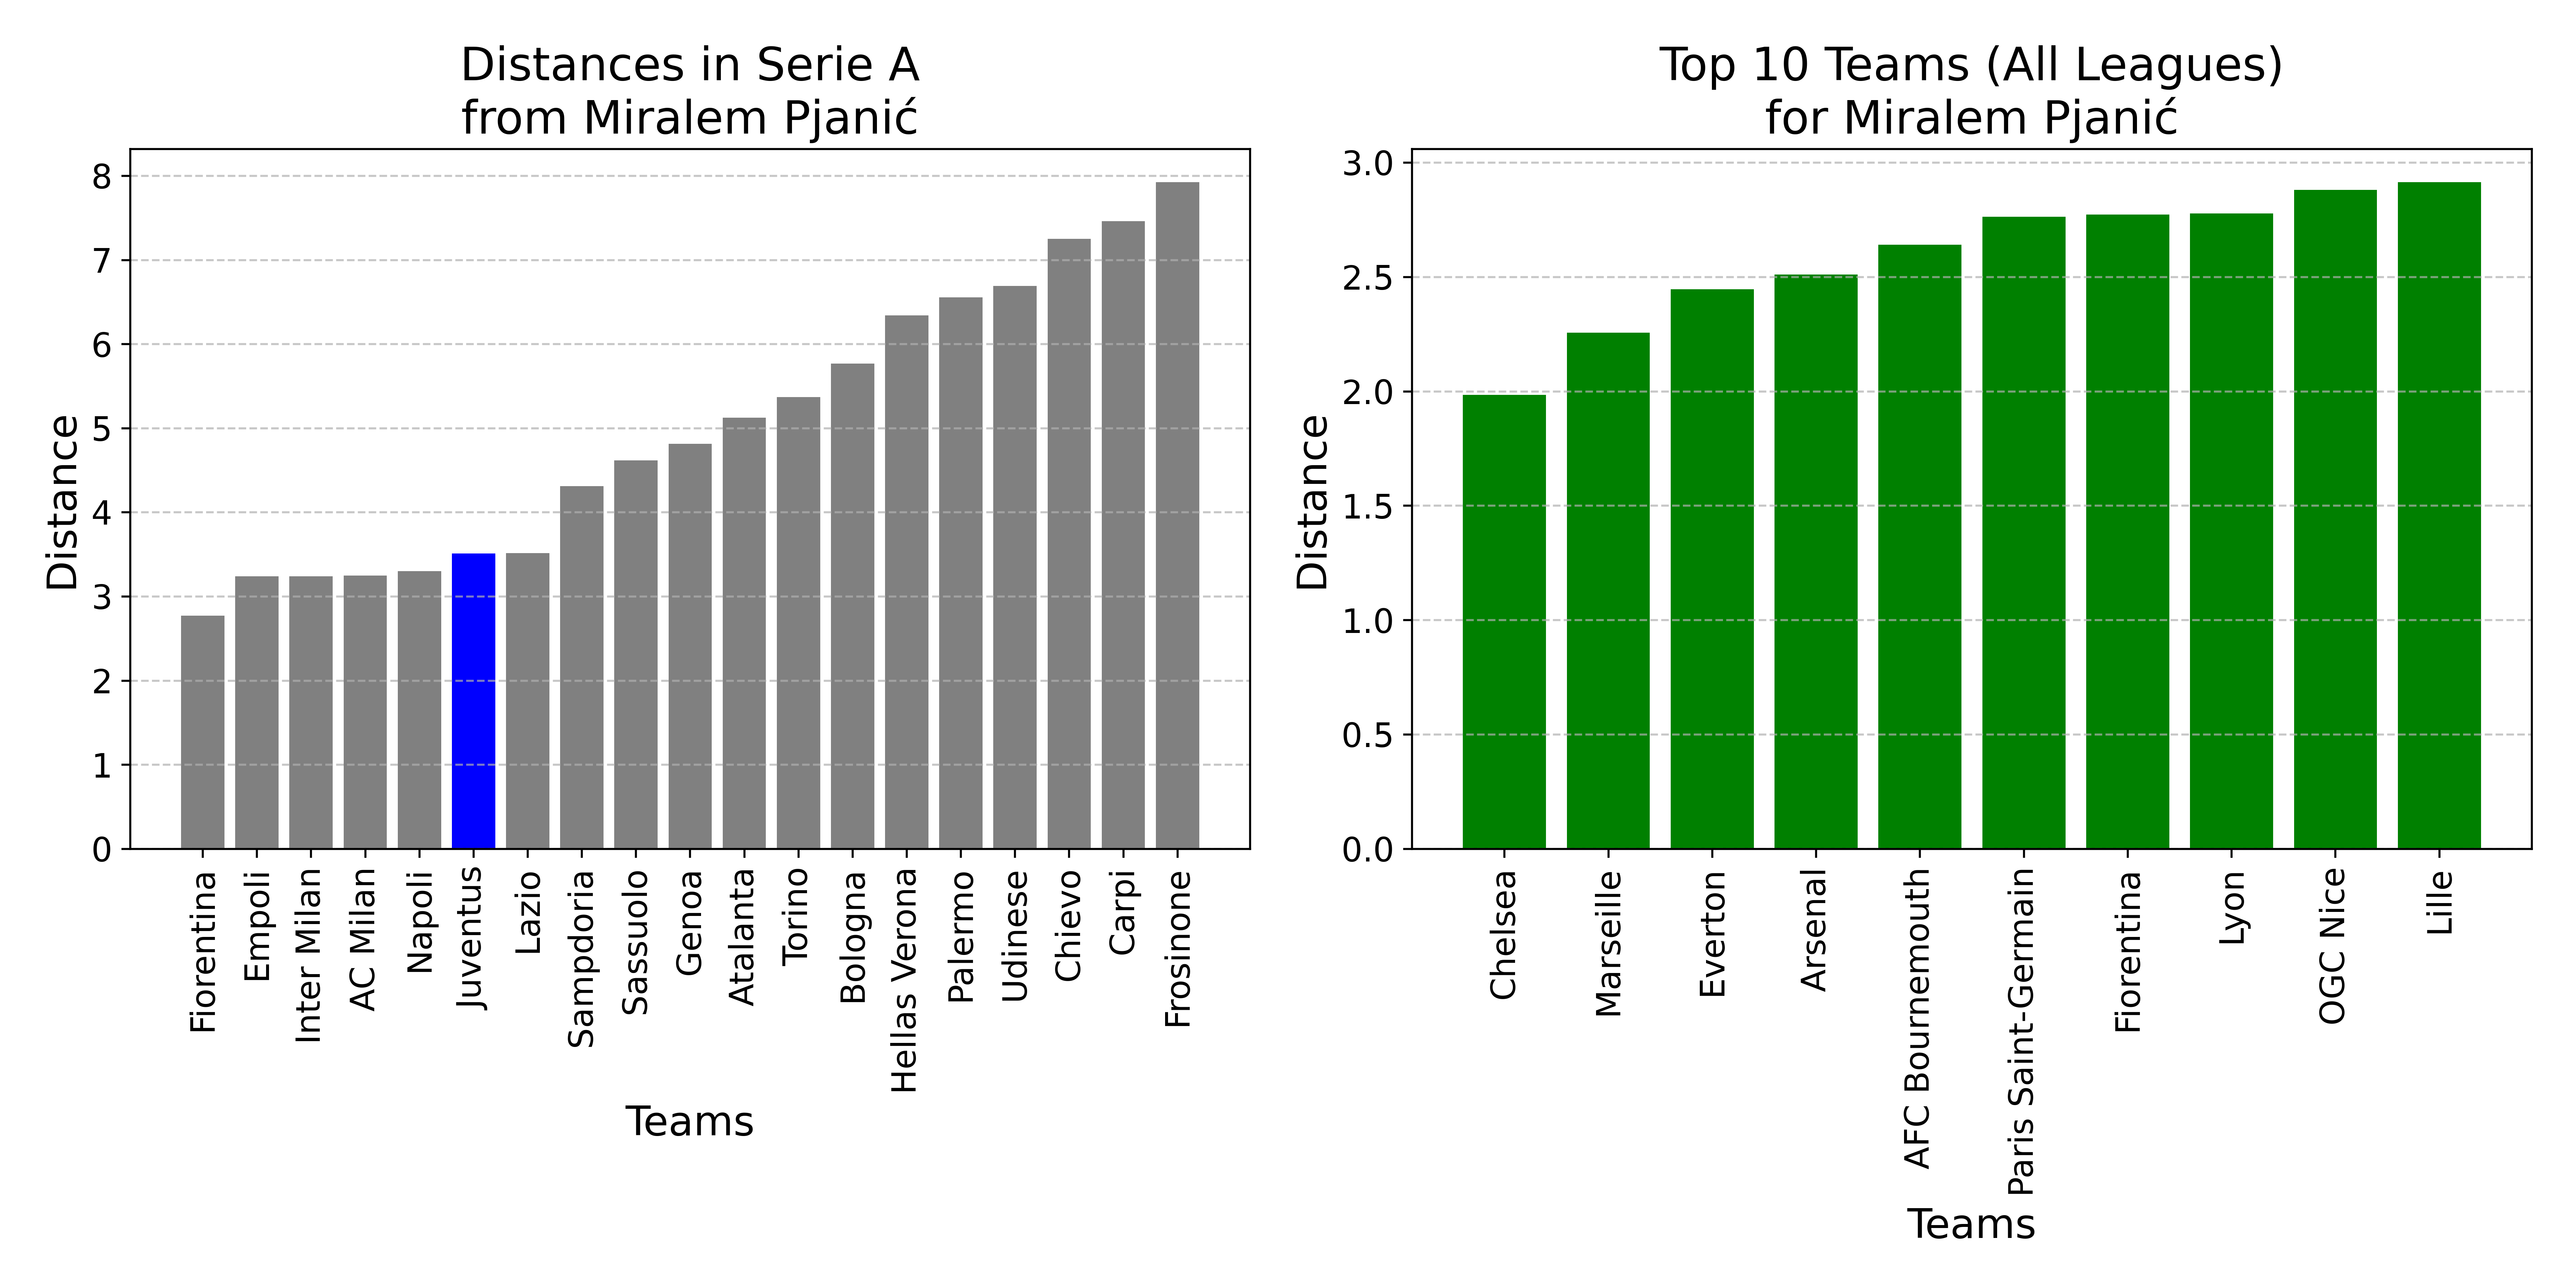
- Within Serie A:
- Fiorentina (2.77)
- Empoli (3.24)
- Inter Milan (3.24)
- AC Milan (3.25)
- Napoli (3.30)
- Juventus (3.51)
- Juventus stands in 6th place for Pjanić’s style alignment among Serie A clubs.
- Across the top five leagues:
- Juve ranks 27th overall, behind teams like Chelsea, Marseille, and Arsenal.
Four Theme Comparison
- Attacking (PC1)
- Pjanić: 3.29
- Juventus: 3.67
- Meaning: Both are strongly oriented toward generating chances and scoring opportunities, with Juventus being slightly more attack-focused—suiting Pjanić’s creative passing skills.
- Possession (PC3)
- Pjanić: -1.03
- Juventus: -0.36
- Meaning: Juve is closer to neutral; Pjanić is more negative, suggesting he’s even less reliant on slow, methodical buildup. While there’s a small gap, both can operate effectively without an extreme emphasis on possession.
- Defensive (PC2)
- Pjanić: 2.29
- Juventus: -1.01
- Meaning: This is the biggest contrast: Pjanić’s higher score indicates he’s more involved in ball-winning or defensive engagement than Juve’s overall style. However, within a highly structured team, his pressing and interceptions can still be an asset.
- Directness
- Pjanić (PC5): 0.54
- Juventus (PC4): -0.36
- Meaning: Pjanić leans toward more vertical passing, while Juve tilts away from long-ball strategies. The difference isn’t huge, but it implies Juve might prefer a more measured buildup than Pjanić’s natural inclination for direct passes.
Pjanić’s Time at Juventus
Despite not being Juve’s closest stylistic match in Serie A, Pjanić slotted in seamlessly as a deep-lying playmaker or advanced midfielder. His attacking flair and vertical passing complemented a robust Juventus squad that prized both efficiency and high-level creativity. The defensive disparity in PCA scores didn’t hinder his adaptation; instead, Pjanić excelled by dictating tempo, delivering incisive balls, and linking play in midfield. His overall success at Juve underlines how a team’s structure and a player’s individual skill can merge productively—even if the numeric PCA “distance” isn’t minimal.
Paul Pogba – Premier League & Manchester United

Paul Pogba’s return to Manchester United from Juventus in 2016, for a then-record fee, generated widespread debate. A closer look at PCA-based stylistic coordinates shows how Pogba and United align (and diverge) across key dimensions such as attacking output, defensive engagement, possession emphasis, and directness. These data-driven insights help explain both his standout moments and his occasional struggles in the team’s system.
Distance-Based Ranking
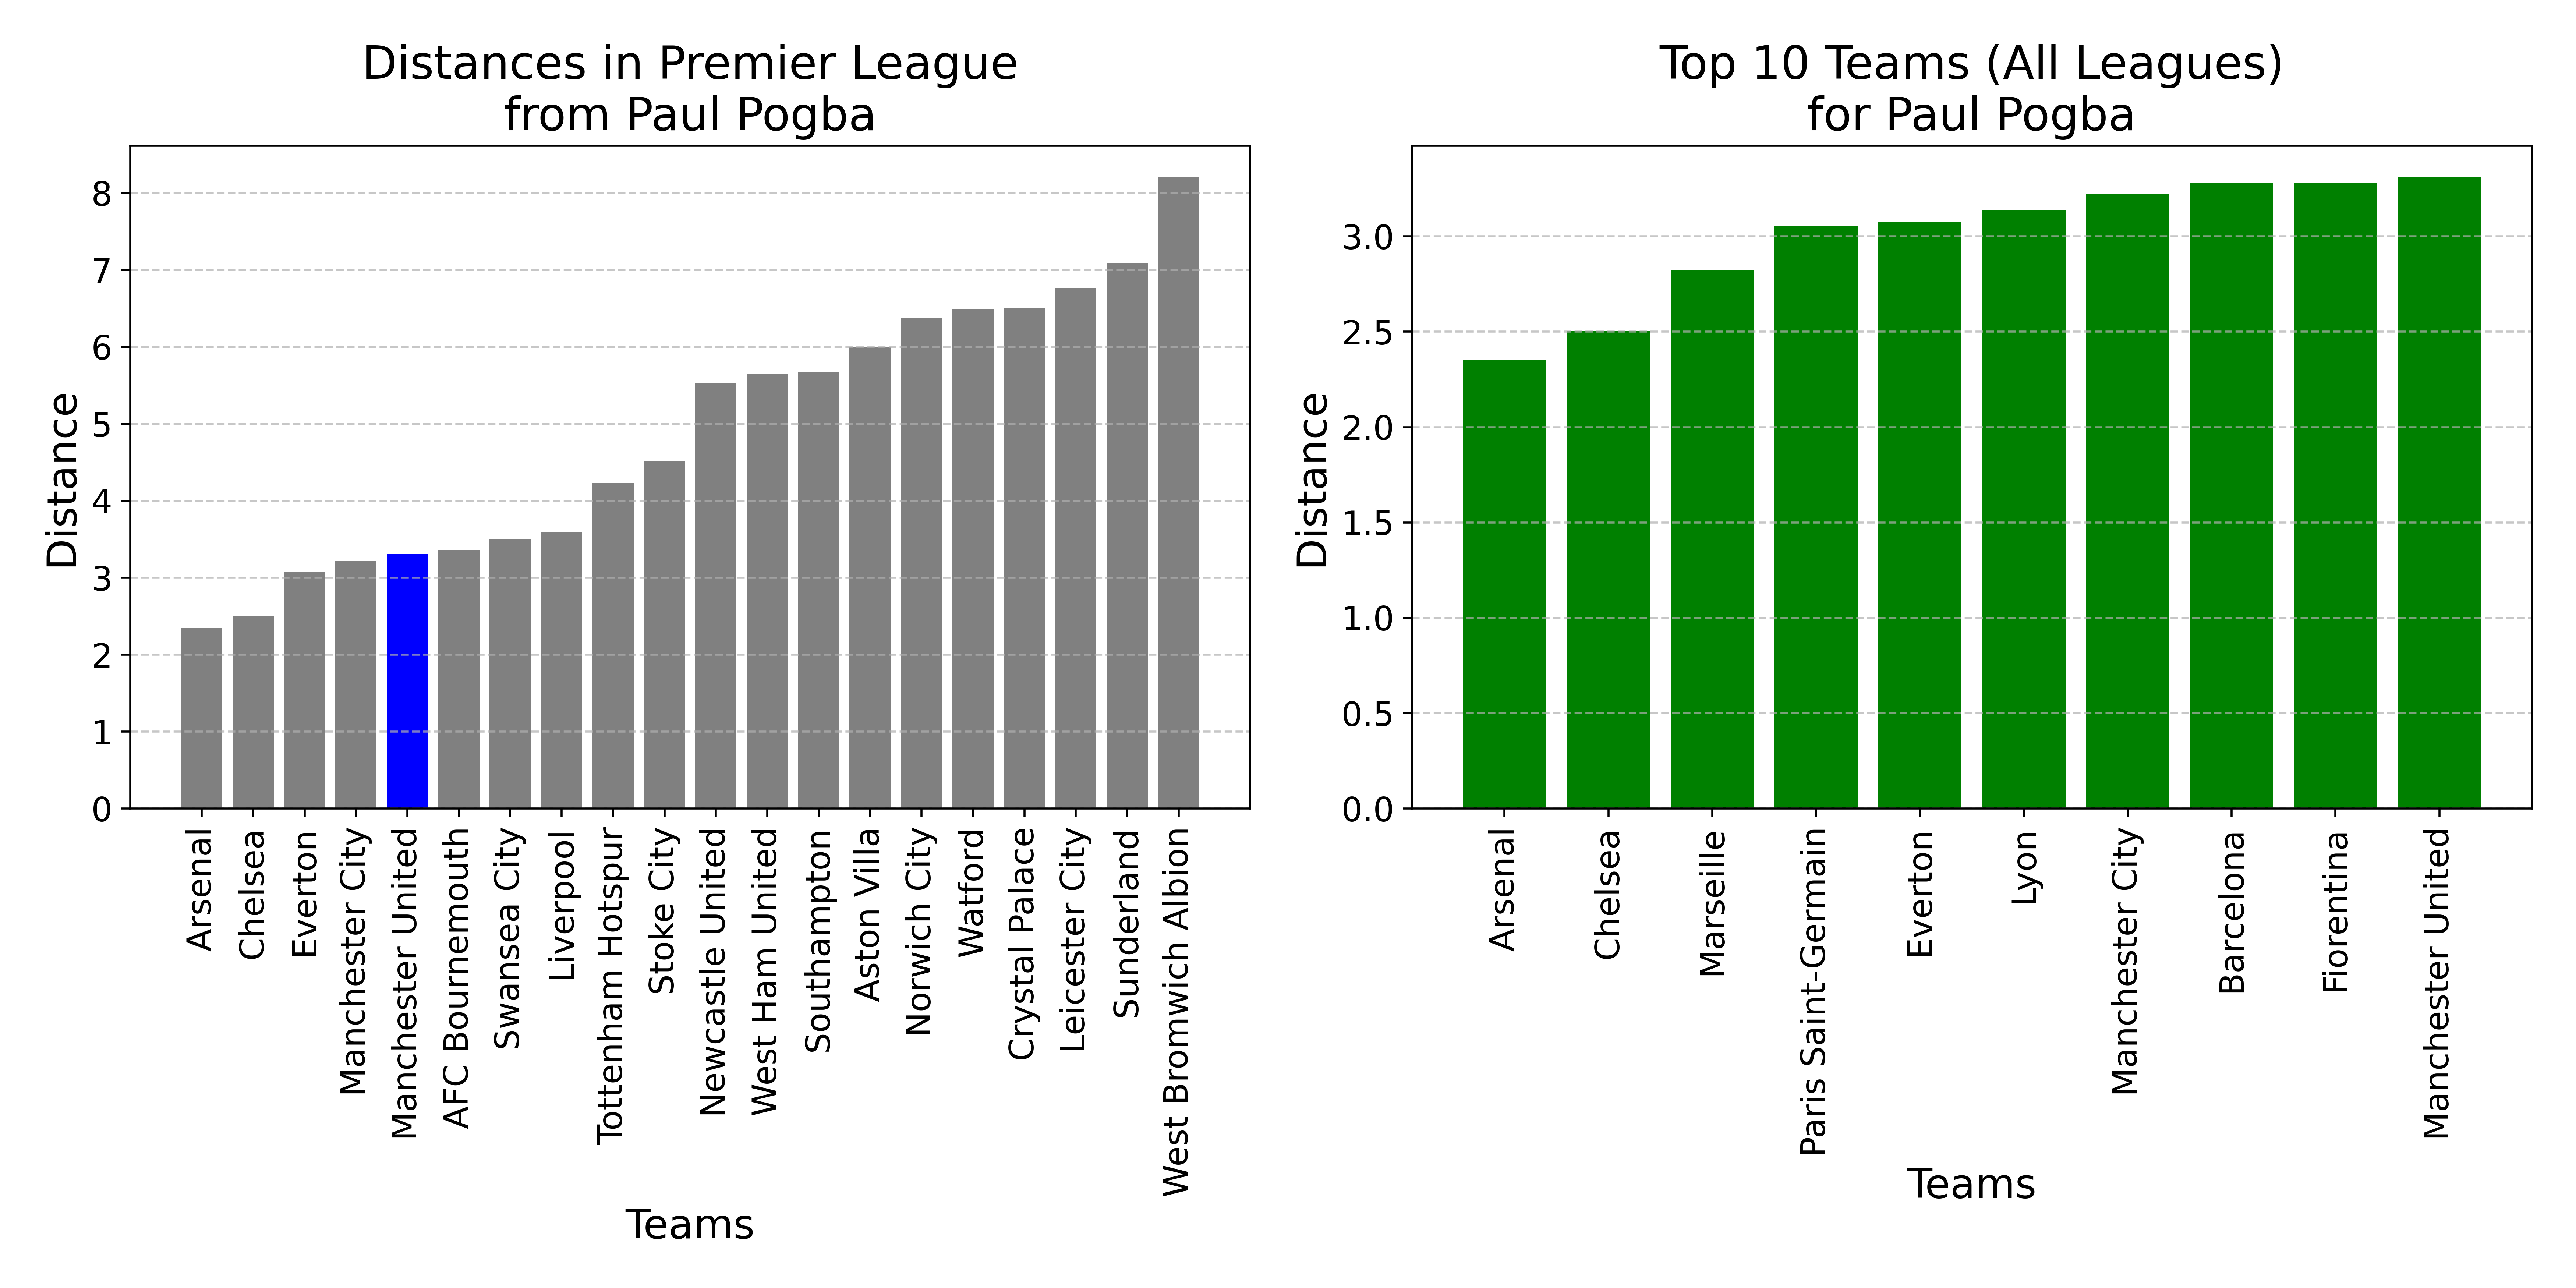
In the Premier League, Arsenal emerged as Pogba’s closest stylistic match, with Manchester United placing 5th. Across the top five leagues, United ranked 10th overall, trailing clubs like Arsenal, Lyon, and Marseille. This ranking is based on percentile metrics (e.g., dribbles per 90, progressive passes) summarized into four shared themes.
Below is a direct comparison of Paul Pogba and Manchester United using these four themes — each mapped to its respective Principal Component (PC) coordinate.
- Attacking (PC1)
- Pogba: 3.797
- United: 0.666
- Meaning: Pogba’s high attacking score reflects strong shooting, xG, and key passing output. United’s more moderate value indicates a less aggressive offensive skew, creating a notable gap in attacking emphasis.
- Defensive (PC2)
- Pogba: 2.782
- United: 2.343
- Meaning: Both register high on duels and interceptions, suggesting active defensive engagement. Pogba’s slightly higher score points to a marginally more proactive ball-winning role.
- Possession (PC3)
- Pogba: -1.134
- United: -1.341
- Meaning: Both are on the “negative” side for possession-heavy play. Neither relies on patient, high-possession buildup—indicating some alignment in preferring quicker transitions over meticulous short-passing.
- Directness
- Pogba (PC5): 0.200
- United (PC4): -0.759
- Meaning: Pogba shows a mild preference for more vertical or longer passing, whereas United’s negative score indicates a less direct approach. This mismatch suggests Pogba’s inclination for rapid forward balls isn’t always mirrored by the team’s tactics.
Overall Verdict
Manchester United are 5th in the Premier League and 10th across the top five leagues in proximity to Pogba’s 4D style vector. Although United’s moderate attacking and less direct style offers only partial synergy with Pogba’s dynamic, attack-minded profile, their shared inclination for quicker transitions—rather than slow possession—provided some common ground. Ultimately, these data underscore why Pogba’s brilliance occasionally shone (thanks to his robust defensive and transitional skills) yet also reveal the mismatch in attacking aggressiveness and directness. Over time, this partial misalignment contributed to periods of inconsistency in his United career.
İlkay Gündoğan – A Tale of Two Manchester Teams

İlkay Gündoğan’s 2016 move from Borussia Dortmund to Manchester City was the first signing of Pep Guardiola’s tenure. A PCA-based analysis highlights Gündoğan’s stylistic alignment with both Manchester clubs—showing some unexpected results when comparing him to Manchester City vs. Manchester United. It also underscores how real-life managerial changes can reshape a team’s playing style in ways not always captured by single-season statistics.
Distance-Based Overview
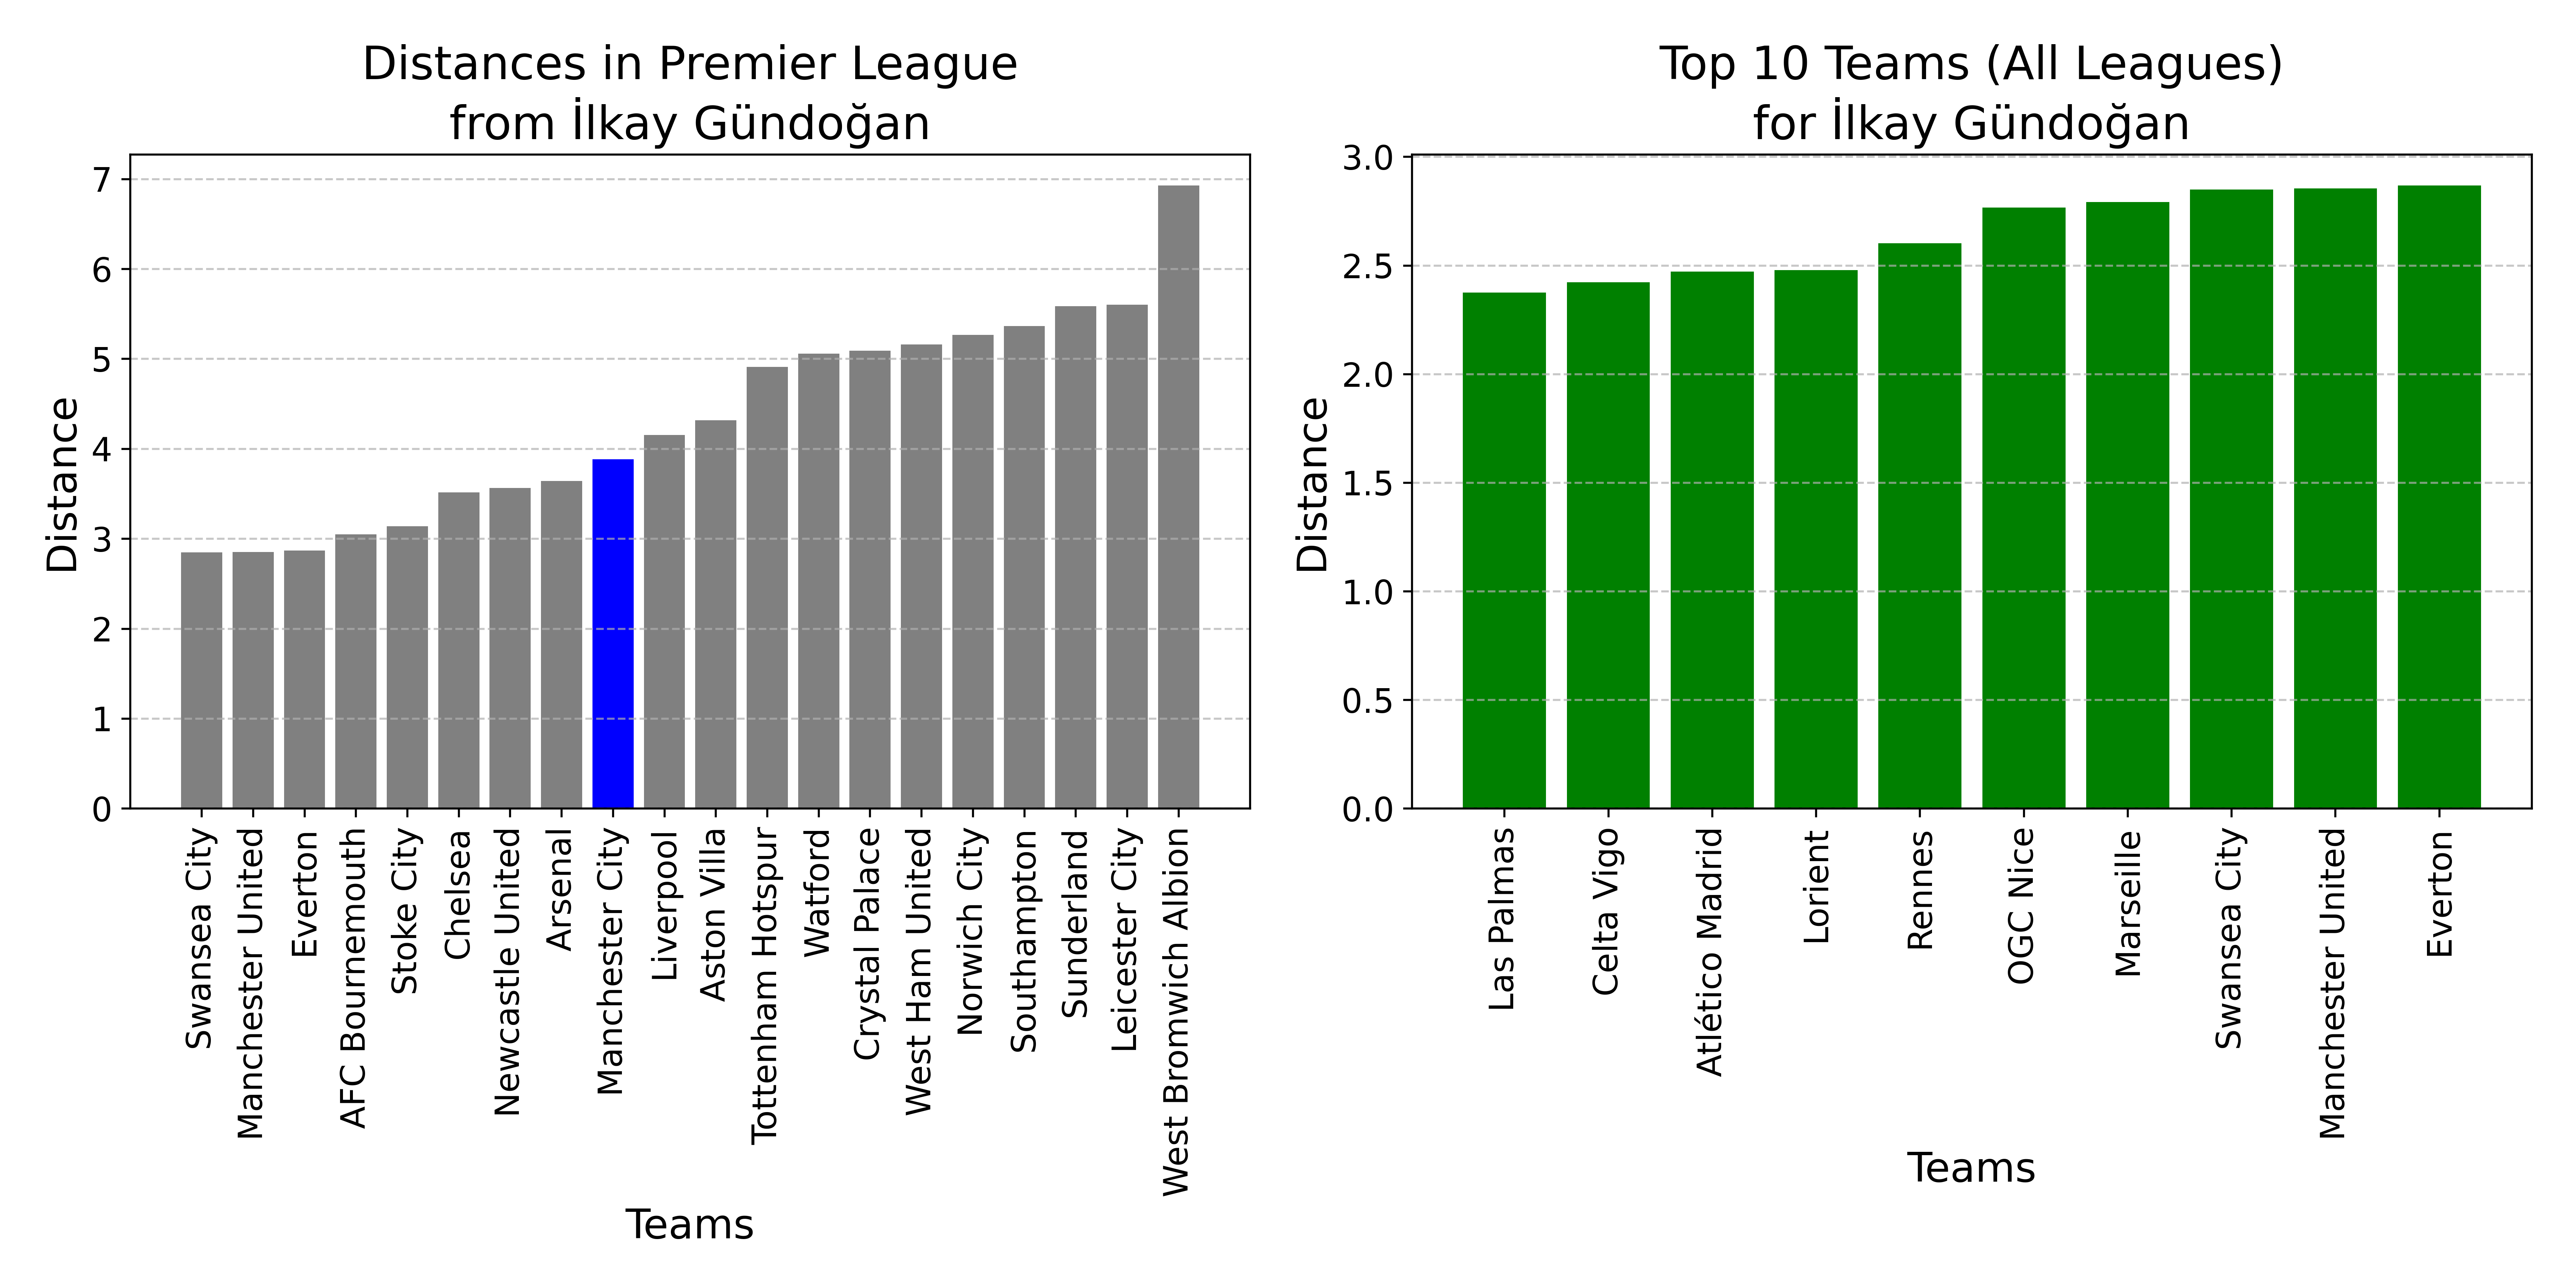
- Premier League ranking for Gündoğan:
- Swansea City (2.85)
- Manchester United (2.86)
- Everton (2.87)
- AFC Bournemouth (3.05)
- Stoke City (3.14)
- Chelsea (3.52)
- Newcastle United (3.57)
- Arsenal (3.64)
- Manchester City (3.88)
- Top 5 leagues ranking:
- Manchester City sits 22nd overall.
Interestingly, Manchester United ranks #2 in the Premier League subset for Gündoğan—i.e., a seemingly closer statistical match than City—while teams like Swansea (#1) and Stoke (#5) also appear closer to Gündoğan on paper than City. These placements reflect 2015–16 season data, when City was still under Manuel Pellegrini, rather than Pep Guardiola’s subsequent influence.
Four Theme Comparison
Using the Players (PC#) → Teams (PC#) approach:
- Attacking (PC1)
- Gündoğan: 2.03
- Man City: 4.73
- Meaning: City sits far on the attacking side (shots, xG, chance creation), while Gündoğan is still above average. The gap suggests City’s overall offensive lean outstrips Gündoğan’s individual attacking metrics, though he remains an offensively adept midfielder.
- Possession (PC3)
- Gündoğan: 0.52
- Man City: 1.26
- Meaning: Both favor keeping the ball, but City’s high positive value indicates a heavier emphasis on possession. Gündoğan’s moderate score signals he’s comfortable in buildup yet not as strictly possession-dominant as City’s average style.
- Defensive (PC2)
- Gündoğan: 3.52
- Man City: 0.84
- Meaning: Gündoğan shows a strong engagement in duels/interceptions, while City’s lower number suggests a broader, more attack-focused style. For a Pep-led system, pressing is crucial, but the defensive load may not rest primarily on a single midfielder.
- Directness
- Gündoğan (PC5): 0.43
- Man City (PC4): 0.14
- Meaning: Both are slightly positive, implying a willingness to use direct passes alongside possession. Gündoğan appears a bit more inclined toward vertical balls, though City under Guardiola typically mixes short-passing with incisive final-third entries.
Reconciling the Odd Results
- Manchester United appears surprisingly closer to Gündoğan than City in the PCA. One key driver is pass length or certain transitional metrics from 2015–16, which favored United’s profile under Louis van Gaal or early Mourinho phases.
- Swansea or Stoke also rank higher—likely due to how the data weights certain possession or directness variables. In reality, these clubs differ substantially in tactical quality and resources compared to a Guardiola-led City.
Gündoğan’s Adaptation to Guardiola’s System
By the time Gündoğan joined, Pep Guardiola** was reshaping City’s playing style to emphasize possession, fluid attacking movement, and intense pressing. The PCA data reflect the previous City under Pellegrini—less aligned with Gündoğan’s skill set on paper. Despite what the numbers suggest, Gündoğan quickly became pivotal under Pep, offering:
- Progressive Passing & Ball Control: Perfect for Pep’s fluid buildup through midfield.
- Press Resistance: Gündoğan’s composure under pressure allowed City to dominate possession.
- Linking Attacks: His advanced positioning and incisive final-third passes fit City’s push for quick transitions after building from the back.
Ultimately, while the PCA ranked City lower than expected, real-world performance confirmed that Gündoğan’s techniques and Guardiola’s tactics meshed beautifully—proving how managerial philosophy and a player’s intangible qualities can outweigh raw statistical distance.
Caveats, Limitations, and Potential Improvements
- Overemphasis on Dominant Metrics
- Issue: A single variable (e.g., average pass length) can dominate the variance in PCA, skewing results and producing misleading rank orders (e.g., Gündoğan seemingly closer to Manchester United because of pass-length similarities).
- Improvement: Examine factor loadings closely to identify dominant metrics. Consider dropping or transforming overly influential columns, and conduct multiple PCAs (with or without certain metrics) to see if results are consistent.
- Lack of Tactical Context
- Issue: PCA uses events data without direct measures of tactical nuances (e.g., pressing styles, transitions). A team might appear more direct if the coach emphasizes quick breaks, but that nuance may get lumped into a single “Directness” PC. Furthermore, teams can undergo radical style changes (e.g., Pellegrini’s vs. Guardiola’s Man City).
- Improvement: Incorporate additional tactical variables—like pressing intensity (PPDA), formations, or possession-phase data—so that PCA can capture more of each team’s real on-field approach. Also, partition data by manager tenure to reflect style shifts.
- Role- or Position-Specific Analysis
- Issue: A single PCA across all players may dilute meaningful variation in certain positions. A full-back’s “Defensive” emphasis is not directly comparable to a defensive midfielder’s.
- Improvement: Run PCA on subsets (e.g., only center-backs, only attacking mids). This provides more position-specific insights and reduces noise from mixing fundamentally different roles.
- Tactical Variables & Managerial Shifts
- Issue: Purely event-based metrics don’t capture how managers instruct players or how a formation might change in real time.
- Improvement: Add metrics tracking different phases of play (build-up vs. final third), pressing/trapping style, or expected formation roles. Split or label data by manager eras to reflect how a team’s style evolves.
- Clustering & Hybrid Methods
- Issue: PCA alone prioritizes maximizing variance explained, but it doesn’t necessarily group teams/players with similar “styles” into clear buckets.
- Improvement: Pair PCA with clustering (e.g., k-means or hierarchical). First, reduce dimensionality via PCA, then cluster based on principal components to identify coherent “style families.” This helps interpret which teams or players belong to similar tactical groups.
- Comparing Coordinates, Not Just Ranks
- Issue: A single distance rank can hide how or why a player is close or far from a team.
- Improvement: Inspect the exact PC coordinates (Attacking, Possession, Defensive, Directness, etc.) for both the player and the team to see where a mismatch or synergy arises. This detailed view is often more informative than a simple “distance” number.
By combining these considerations—incorporating tactical data, running position-specific analyses, carefully aligning player and team spaces, and augmenting PCA with clustering—analysts can form a richer, more accurate picture of how well a player’s style might fit a given team’s approach. Ultimately, PCA should be viewed as a foundation for stylistic insights rather than a definitive statement on transfer suitability.
Why Compare Coordinates (Not Just Ranks)?
While distance-based ranks are helpful for a quick overview, examining each dimension’s coordinates can reveal:
- Where the style mismatch or synergy occurs (Attacking? Possession? Directness?).
- How large each gap is (a slight difference in “Defensive” might matter less than a huge difference in “Attacking”).
- Potential tactical solutions (e.g., if a team’s “Directness” is lower but the player thrives in more direct transitions, the coach can adjust to accommodate that strength).
Thus, PCA remains a valuable first step in data-driven player-team evaluations. Reading both the numeric distances and the underlying PC values can illuminate nuanced fits—an approach that is even more powerful when supplemented by tactical knowledge, role-specific breakdowns, and cluster-based groupings. In short, a combined qualitative + quantitative lens helps ensure the richest insights into potential player-team compatibility.